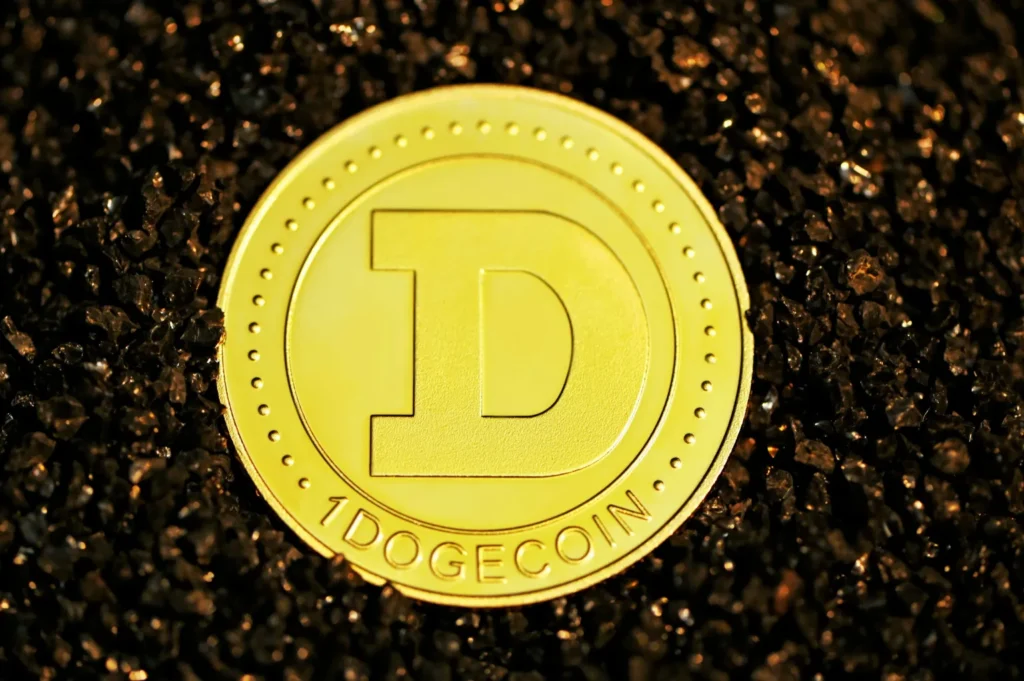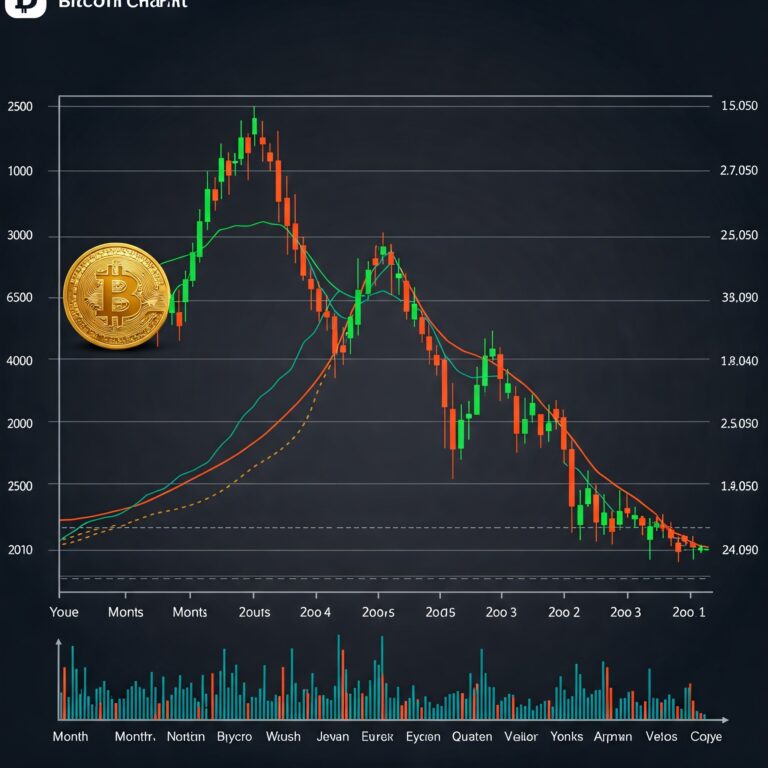
Dogecoin (DOGE), the original meme coin, is showing an intriguing technical pattern on its daily chart. A symmetrical triangle, often seen as a neutral formation, has emerged, suggesting a potential breakout is imminent. Traders are closely watching the direction of this breakout, which could signal significant price movement for DOGE in the coming days.
📊 What is a Symmetrical Triangle?
A symmetrical triangle is a chart pattern characterized by converging trendlines connecting higher lows and lower highs. This pattern typically indicates a period of consolidation before a significant price breakout, either upward or downward. The breakout direction often depends on the overall market sentiment and key catalysts.
🔑 Dogecoin’s Current Chart Setup
- Triangle Formation: DOGE has been trading within a narrowing range, with strong support around $0.07 and resistance near $0.075. The triangle pattern indicates growing pressure that will likely lead to a decisive breakout.
- Volume Decline: A decrease in trading volume accompanies the pattern, which is typical during the consolidation phase. A volume spike following the breakout would confirm its validity.
- Indicators: The Relative Strength Index (RSI) is hovering around the neutral 50 level, giving DOGE room to move in either direction without being overbought or oversold. Moving averages are acting as dynamic support and resistance levels.
🚀 Bullish Scenario: Breakout to the Upside
If DOGE breaks above the triangle’s upper resistance at $0.075:
- Target Levels: An upward breakout could see DOGE rally toward $0.085 or even $0.09, based on the triangle’s height projected from the breakout point.
- Catalysts: Positive news, such as increased adoption, collaboration announcements, or broader market recovery, could drive this move. Dogecoin often reacts to social media hype and influencer activity, making sentiment a key factor.
📉 Bearish Scenario: Breakout to the Downside
If DOGE breaks below the lower support at $0.07:
- Target Levels: A bearish breakout could push DOGE down to $0.065 or even $0.06, depending on selling pressure.
- Catalysts: Negative developments, such as regulatory concerns or broader market declines, could trigger this move. A lack of interest in meme coins could also weigh on DOGE’s price.
🔍 What to Watch For
- Volume Surge: A spike in volume will be a key confirmation of the breakout direction.
- Market Sentiment: Dogecoin often moves with broader market trends, so keep an eye on Bitcoin and Ethereum price action.
- News and Social Media: DOGE’s price is highly sensitive to community-driven hype, so monitoring social media platforms like Twitter can offer additional clues.
Conclusion
Dogecoin’s symmetrical triangle pattern suggests a major move is on the horizon. If the breakout is bullish, DOGE could target levels around $0.085 or higher. Conversely, a bearish breakout may lead to retests of lower support levels. Traders should prepare for volatility and wait for confirmation before entering positions.


