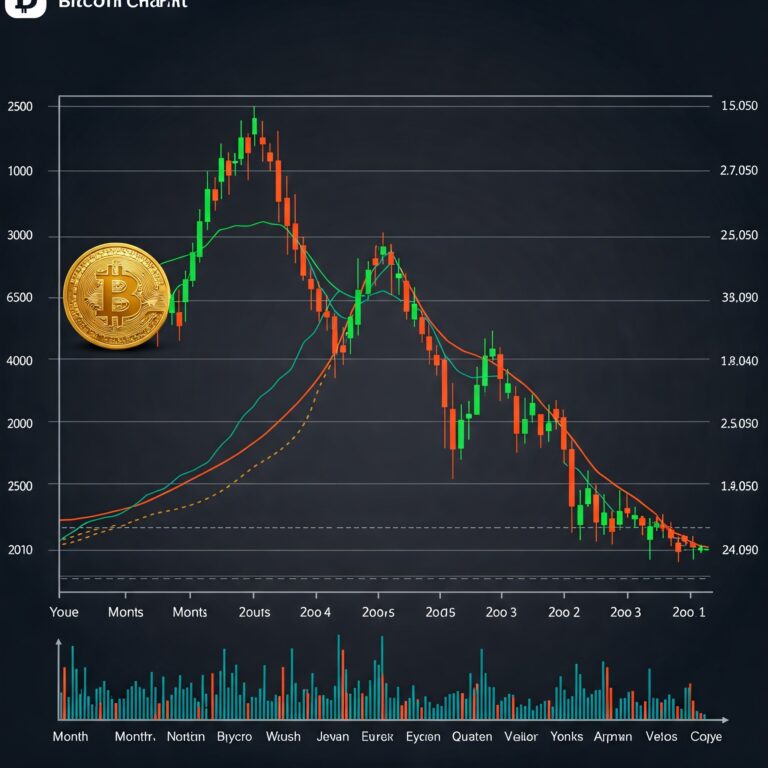
Bitcoin (BTC) has formed a double bottom pattern following its recent crash, sparking speculation about a potential rebound to new all-time highs (ATH). Analysts are closely watching key levels to determine if BTC can rally toward $112,000 in the coming months.
1. What Is the Double Bottom Pattern?
A double bottom is a bullish reversal pattern that signals a potential trend change from bearish to bullish. This formation occurs when Bitcoin hits a key support level twice before rebounding, suggesting strong buying interest.
2. Key Resistance Levels to Watch
For Bitcoin to confirm a breakout:
✅ BTC must break above critical resistance at $75,000–$80,000.
✅ A move past psychological levels like $100,000 could fuel further momentum.
3. Market Catalysts for a Potential Rally
- Bitcoin ETF Demand: Institutional buying continues to support long-term price growth.
- Halving Effect: The next Bitcoin halving, reducing miner rewards, could tighten supply and push prices higher.
- Macroeconomic Factors: Interest rates and inflation data will influence investor sentiment toward BTC.
4. Can BTC Hit $112,000?
If Bitcoin breaks resistance and follows historical post-halving patterns, analysts believe a rally to $112,000 ATH is possible. However, rejection at key resistance levels could lead to further consolidation.
Conclusion
Bitcoin’s double bottom is a bullish sign, but confirmation is needed. A break above key levels could trigger a major rally, while failure to do so may lead to extended consolidation. 🚀


