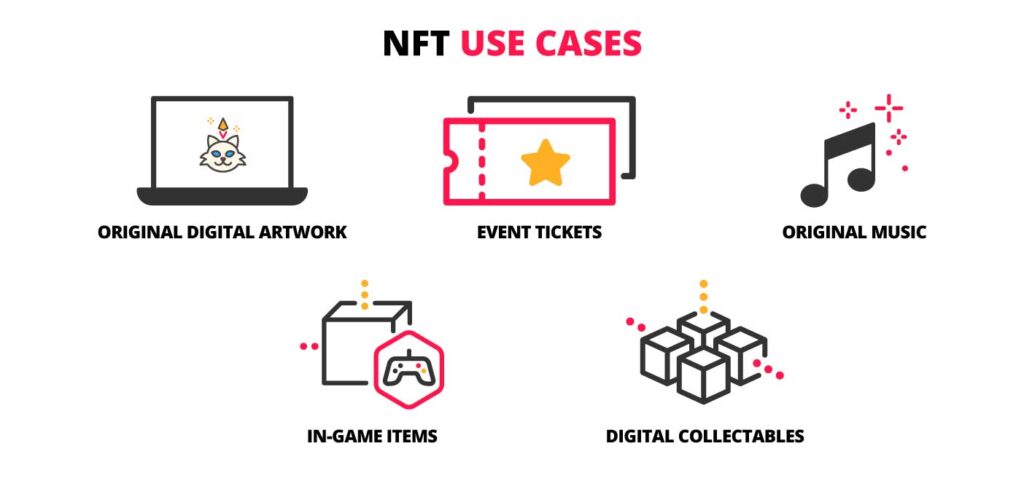
Introduction to NFT Use Cases
Non-fungible tokens (NFTs) have gained immense popularity in recent years, particularly in the digital art space. However, their use extends far beyond just art. NFTs have found applications in various industries, revolutionizing how we think about ownership, provenance, and value in the digital world. This article delves into the many NFT use cases and explores how these unique digital assets are transforming sectors such as art, gaming, real estate, entertainment, and more.
NFTs in Digital Art and Collectibles
1. Digital Art Ownership and Provenance
NFTs have disrupted the traditional art world by offering a new way for artists to monetize their work and maintain ownership rights. Digital art, which once lacked a verifiable ownership structure, now has the backing of blockchain technology. NFTs allow artists to tokenize their work, providing buyers with proof of authenticity and ownership. Notable sales, such as Beeple’s “Everydays: The First 5000 Days,” which sold for $69 million, have brought NFT art into the mainstream.
Use Case:
- Artists and Creators: Artists can tokenize their digital creations, ensuring that buyers receive proof of ownership and authenticity. Moreover, artists can program royalties into NFTs, earning a percentage of the resale value every time their artwork changes hands.
2. NFT Collectibles
NFTs are also heavily used for creating collectible items, which can range from digital trading cards to rare in-game assets. These collectibles can be bought, sold, and traded on various NFT marketplaces. The uniqueness of each item is secured by the blockchain, ensuring that collectors have access to rare and limited-edition assets.
Use Case:
- Digital Collectibles: Popular examples include NBA Top Shot (digital NBA collectibles), CryptoKitties (virtual cats), and Sorare (fantasy soccer cards). These platforms allow collectors to buy, sell, and trade unique digital collectibles, often with added utility in games or virtual spaces.
NFTs in Gaming
The gaming industry has rapidly adopted NFTs, transforming how in-game assets are created, owned, and traded. NFTs allow gamers to have true ownership of their in-game items, such as weapons, skins, and land, which were previously restricted to game publishers’ servers.
1. Play-to-Earn Games
NFTs have introduced a new concept in gaming known as Play-to-Earn (P2E). In these games, players can earn NFTs through gameplay and then sell or trade them in secondary markets. This new economic model allows players to earn real value from the time and effort they invest in games.
Use Case:
- Axie Infinity: One of the most popular P2E games, Axie Infinity, lets players breed, battle, and collect Axies (fantasy creatures) represented as NFTs. Players can sell or trade their Axies, creating a real-world economic ecosystem within the game.
- The Sandbox: A virtual world where users can purchase land, build structures, and create experiences. The land and assets in The Sandbox are tokenized as NFTs, enabling players to monetize their creations.
2. In-Game Assets and Virtual Goods
NFTs are revolutionizing the ownership of in-game assets. Traditionally, gamers rented assets within the game environment, with no true ownership. With NFTs, in-game assets like characters, skins, weapons, and land can be tokenized, allowing players to trade them independently of the game publisher.
Use Case:
- Decentraland: A virtual world that uses NFTs to represent virtual real estate and assets. Players can buy, sell, and develop parcels of land as NFTs, creating a thriving digital economy.
NFTs in Real Estate
NFTs are making waves in the world of real estate, especially in virtual environments and metaverses. These digital spaces, which exist entirely in the online world, have found use cases in tokenizing real estate ownership and providing new avenues for buying, selling, and trading land.
1. Virtual Real Estate
NFTs enable the tokenization of virtual land, turning it into a tradable, ownable asset. In virtual worlds like Decentraland or The Sandbox, parcels of land are bought and sold as NFTs, creating new opportunities for both investors and gamers to acquire and develop virtual properties.
Use Case:
- Virtual Real Estate Investments: Investors can purchase virtual land, develop it with digital assets (such as buildings, shops, or entertainment venues), and monetize it through rental income or reselling the land at a higher price.
2. Real-World Property Tokenization
In addition to virtual land, NFTs are also being explored for tokenizing real-world physical property. By creating an NFT for each property, owners can sell fractional ownership, allowing more people to invest in real estate. This also enables greater liquidity and ease of transferring ownership.
Use Case:
- Property Fractionalization: Platforms like RealT and Propy are experimenting with tokenizing physical real estate, allowing users to buy and sell fractional shares in properties as NFTs.
NFTs in Entertainment and Media
NFTs are also making significant strides in the entertainment industry, offering new ways for creators to monetize their content and interact with fans.
1. Music and Audio NFTs
Musicians and audio creators are beginning to use NFTs as a way to sell their music directly to fans. By tokenizing their music as NFTs, artists can maintain ownership rights and sell limited-edition tracks or albums, providing fans with a sense of exclusivity.
Use Case:
- Royalty-Free Music Sales: Artists can release albums as NFTs, offering limited editions that come with perks like early access or exclusive behind-the-scenes content. Some musicians are even programming their NFTs to pay out royalties directly to fans who purchase the tokens.
- Catalog Ownership: Platforms like Audius allow artists to mint NFTs related to their music, giving fans a stake in the artist’s catalog and creating a more direct revenue stream for creators.
2. Film and Video Content
NFTs are also being explored for tokenizing video content, including short films, documentaries, and even feature films. By minting videos as NFTs, filmmakers can create a new way to sell access to their works, bypassing traditional distribution channels and ensuring that they retain a larger share of the profits.
Use Case:
- Film Distribution: Filmmakers can release their work as an NFT, allowing them to control access, offer exclusive rights to certain content, and even reward early supporters. This opens up new avenues for independent filmmakers to monetize their work.
NFTs in Sports and Fan Engagement
NFTs have the potential to change how fans interact with their favorite sports teams and athletes. From collectible memorabilia to exclusive fan experiences, NFTs can provide fans with unique opportunities to engage with the sports they love.
1. Sports Collectibles
Just as NFTs have disrupted the art world, they are also transforming the sports memorabilia market. Digital trading cards, video highlights, and other sports collectibles are being tokenized as NFTs, allowing fans to buy, sell, and trade them.
Use Case:
- NBA Top Shot: This platform allows basketball fans to purchase, collect, and trade officially licensed NBA highlights as NFTs. Each highlight is a unique NFT, ensuring that fans own an exclusive piece of sports history.
2. Fan Engagement and VIP Experiences
NFTs also allow sports teams and athletes to create exclusive fan experiences, such as VIP tickets, meet-and-greets, and limited-edition merchandise. By offering these as NFTs, teams can build more direct and personalized relationships with their fan base.
Use Case:
- Exclusive Access: Teams can issue NFT-based VIP passes to games, offering fans special access, behind-the-scenes content, or priority seating at live events.
NFTs for Intellectual Property and Licensing
NFTs can also play a significant role in the management of intellectual property (IP). By creating NFTs for certain types of IP, creators can streamline licensing, reduce piracy, and offer more transparent access to their content.
1. Tokenizing Intellectual Property
Creators can use NFTs to represent intellectual property rights, such as patents, trademarks, or copyright licenses. This makes it easier for IP owners to track usage, enforce rights, and license their content to others.
Use Case:
- IP Licensing: An artist could tokenize their IP (e.g., a specific character design or logo) and license it for use by others, ensuring that royalties are automatically paid when the IP is used in other projects.
Conclusion: The Expanding World of NFTs
NFTs have evolved far beyond their initial use in digital art, becoming a transformative force across numerous industries. From gaming and virtual real estate to entertainment and intellectual property, NFTs are enabling new forms of ownership, value exchange, and creative expression. As the technology matures, more sectors will likely find innovative ways to leverage NFTs, creating even more use cases and opportunities for creators, collectors, and investors alike.