XRP‘s Critical Price Levels: A Breakdown
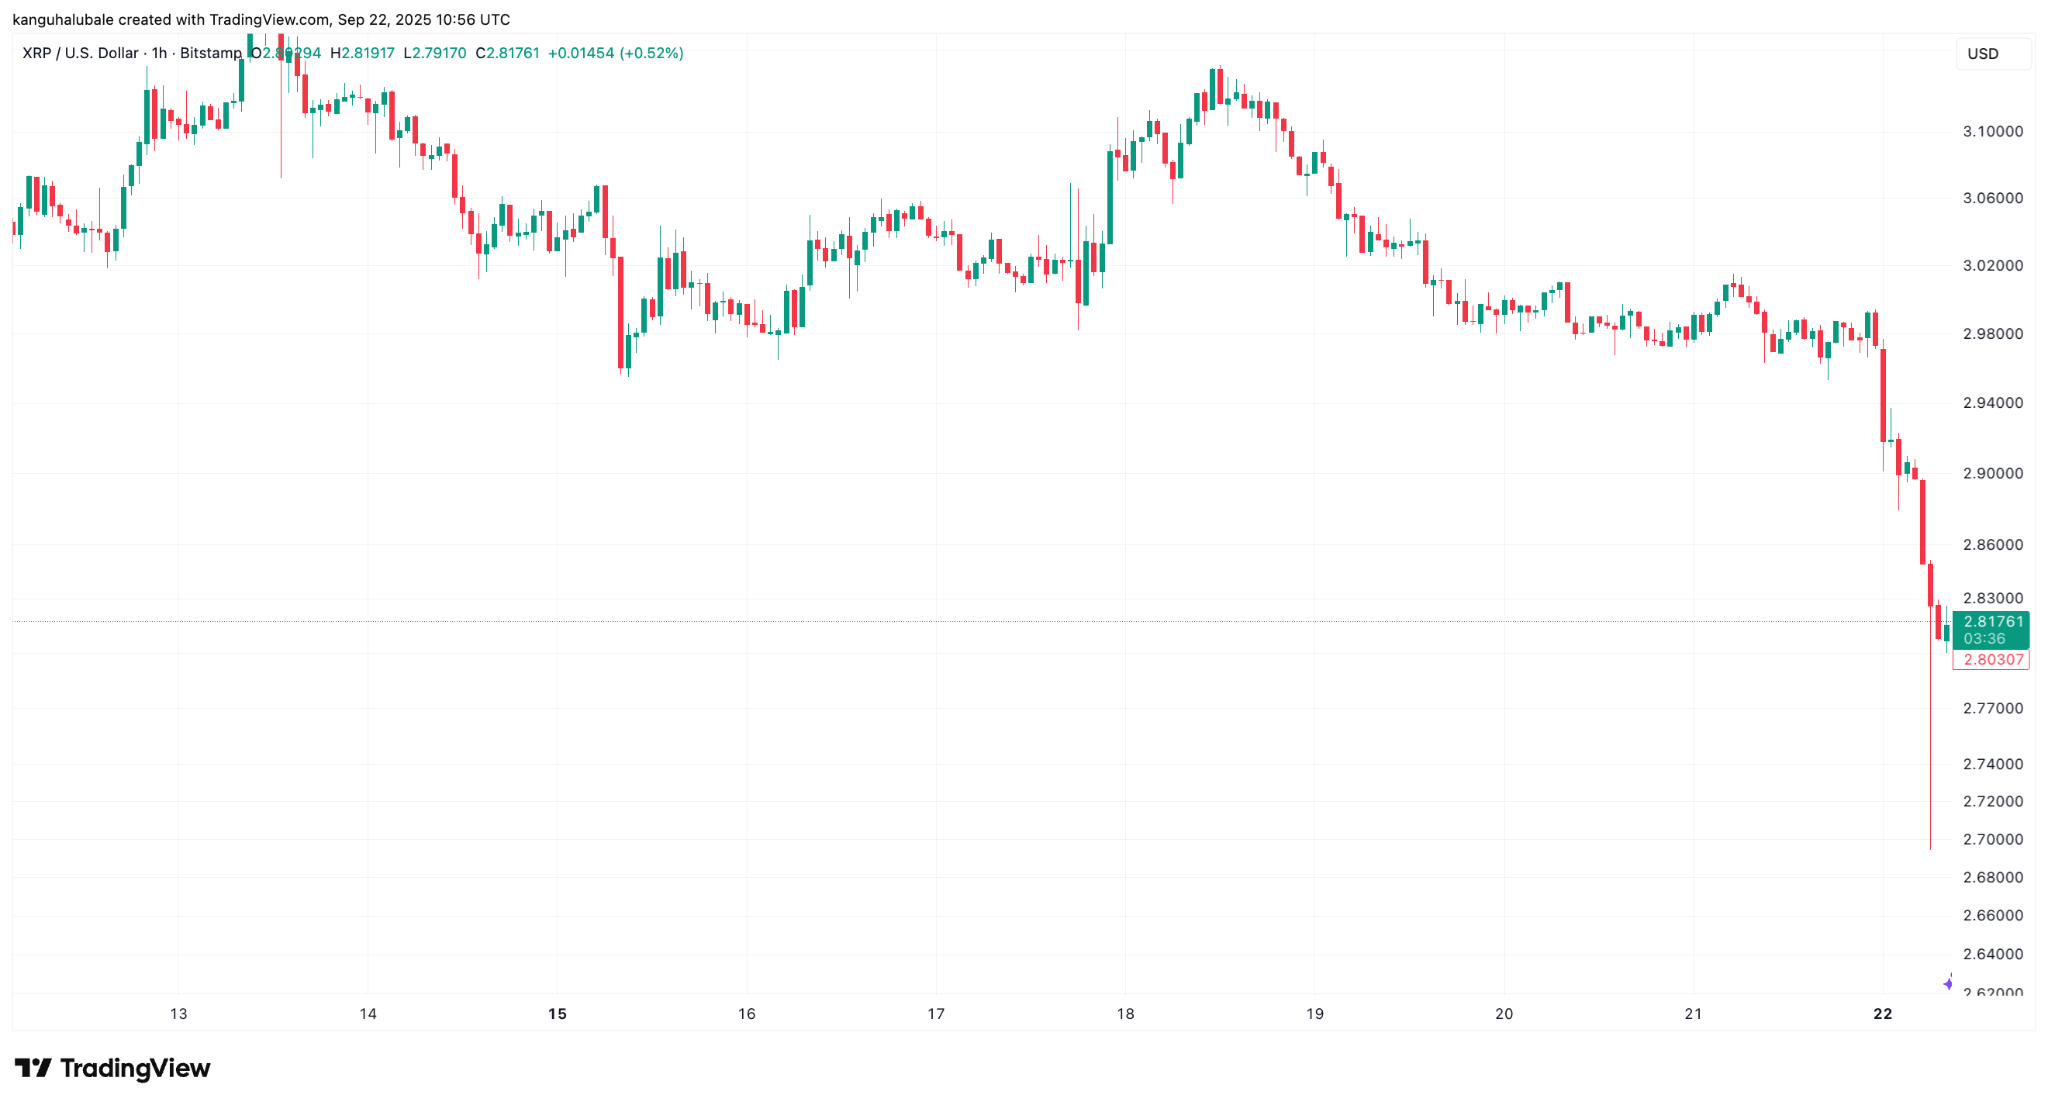
The cryptocurrency XRP is currently navigating a precarious moment, with its price action raising concerns among traders and investors. Having dipped below the crucial $3 mark, the altcoin now faces a confluence of bearish indicators that could portend a more significant price correction. This article delves into the technical and on-chain factors contributing to the current market sentiment surrounding XRP.
Bearish Patterns and Potential Targets
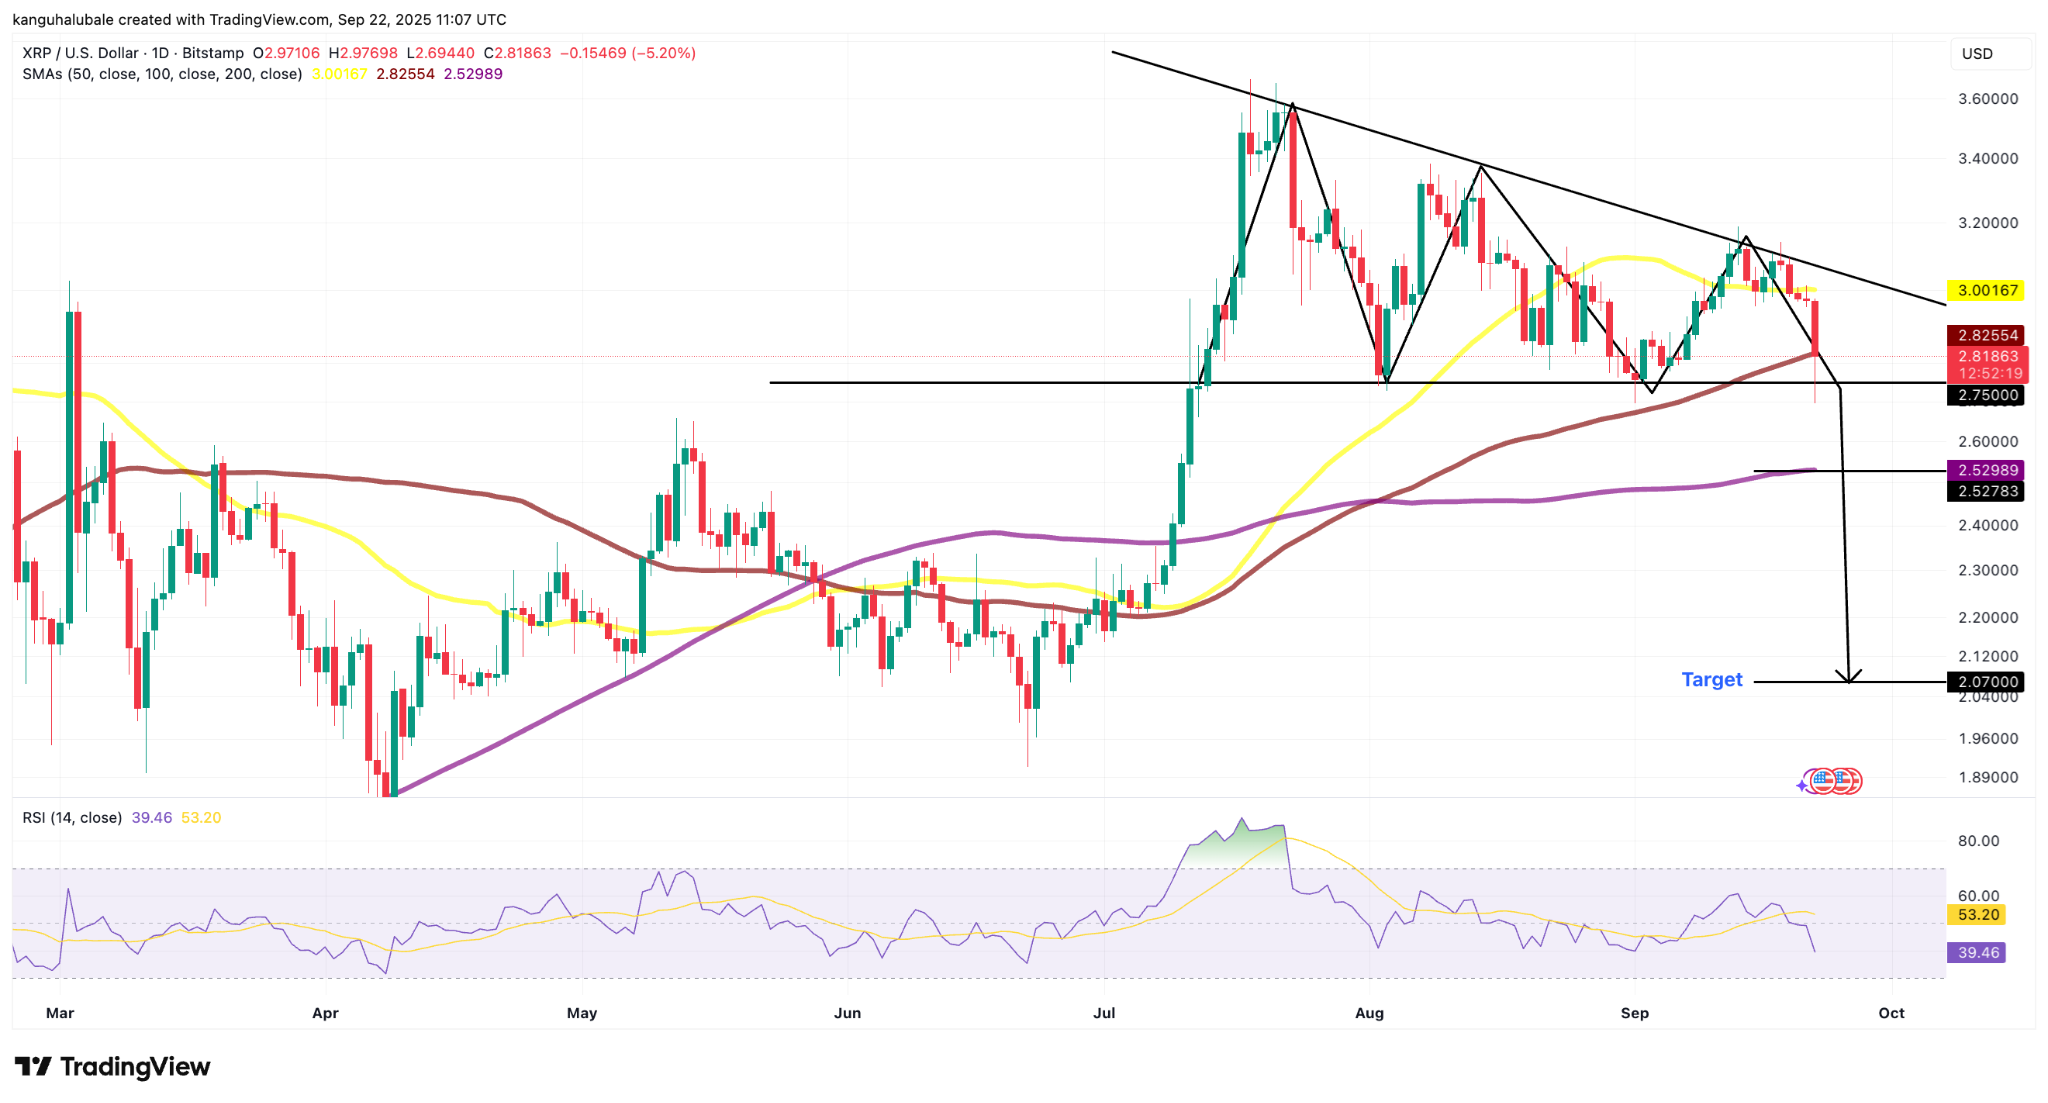
From a technical analysis perspective, XRP is exhibiting signs of weakness. The formation of a descending triangle on the daily chart is particularly noteworthy. This pattern, characterized by a descending resistance trendline and a flat support level, often precedes a bearish breakdown. If XRP fails to hold above the support level around $2.75, a sharp decline could be triggered, potentially targeting the $2.07 level. This target is derived from the height of the triangle, projecting a significant downward move.
On-Chain Signals and Investor Sentiment
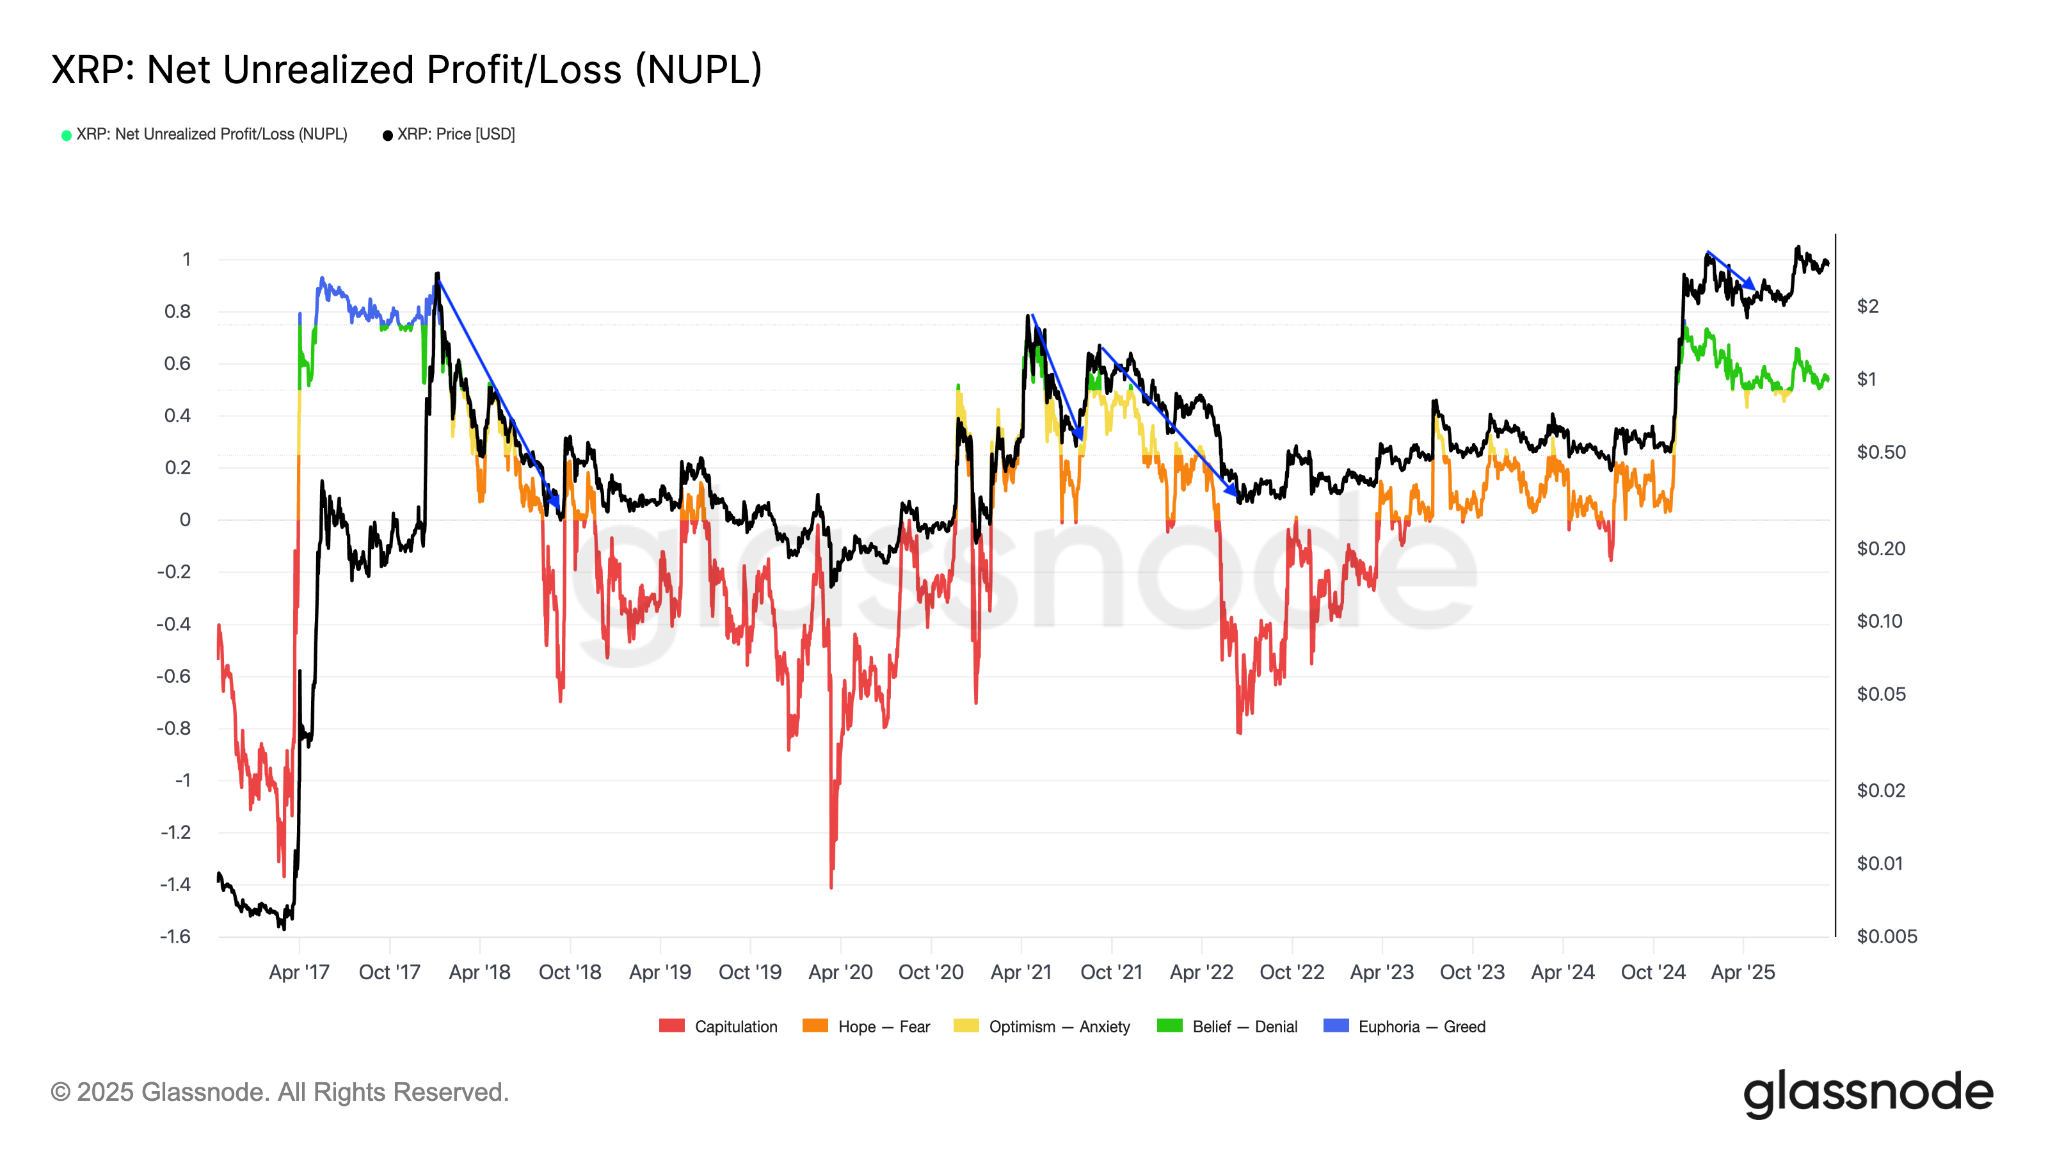
Beyond the chart patterns, on-chain metrics are also flashing warning signs. The Net Unrealized Profit/Loss (NUPL) indicator, which gauges the overall profitability of XRP holders, has entered a zone historically associated with local market tops. Coupled with the fact that a significant portion of the XRP supply is currently in profit, the risk of increased selling pressure appears to be elevated. This confluence of factors increases the likelihood of a sustained price correction.
Contrasting Perspectives: Bullish vs. Bearish Forecasts
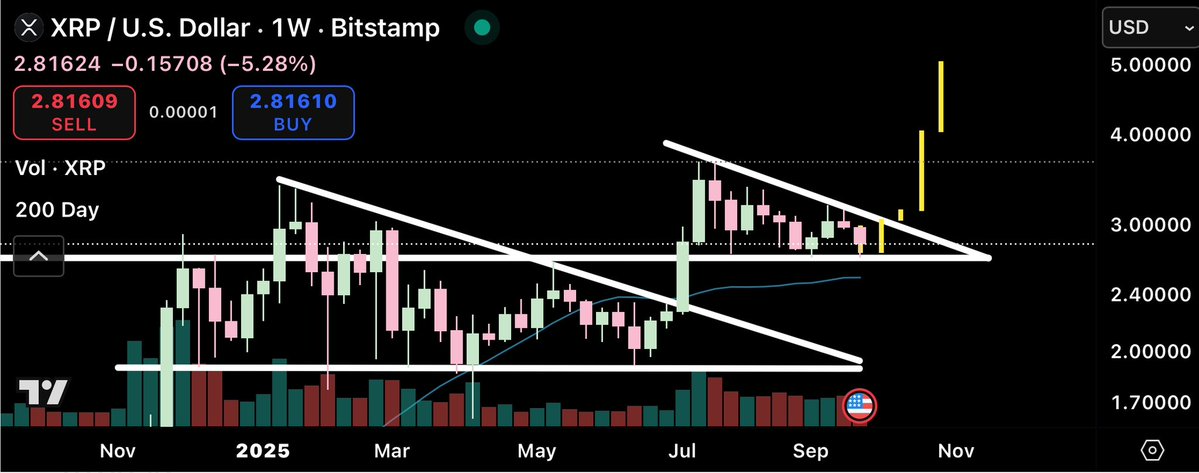
Despite the bearish indicators, a segment of analysts remains optimistic. Some analysts are pointing to larger timeframe charts and patterns, with price targets significantly higher. These bullish forecasts suggest the current downturn may be a temporary pullback within a broader uptrend. Support from analysts using Elliott Wave analysis have projected targets of $20+, while others suggest potential gains to $5, or even $15. The divergent views underscore the inherent uncertainty in the crypto market and the importance of individual research.
Key Considerations for Investors
Investors should carefully monitor several key levels. Firstly, holding above the $2.75 support level is critical for the bulls. Secondly, the 200-day SMA, currently around $2.52, could act as a potential support zone. The Relative Strength Index (RSI) also bears watching as it indicates downward momentum. As always, readers should conduct their own due diligence before making any investment decisions. Understanding these conflicting signals, along with the ongoing Ripple vs. SEC case, is crucial to navigating the current XRP landscape. The market’s reaction to the $3 level will likely set the near-term tone for XRP’s price trajectory.