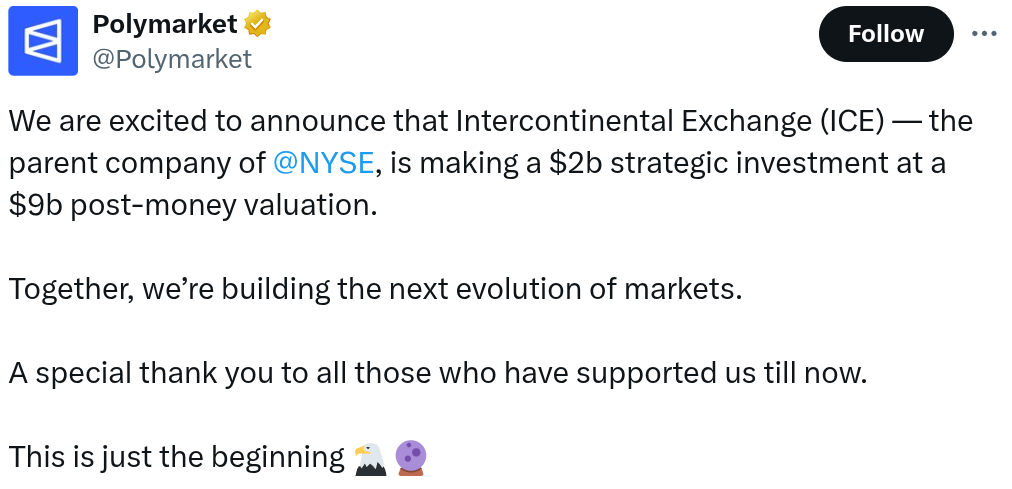
ICE‘s Bold Move: A $2 Billion Injection into Polymarket
In a landmark deal that underscores the increasingly blurred lines between traditional finance and the crypto realm, Intercontinental Exchange (ICE), the parent company of the New York Stock Exchange (NYSE), has invested a staggering $2 billion into Polymarket. This substantial investment values the cryptocurrency-based prediction market at an impressive $9 billion. This move marks a significant endorsement of the burgeoning prediction market sector and signals ICE‘s strategic vision for the future of finance.
Polymarket: Beyond the Hype
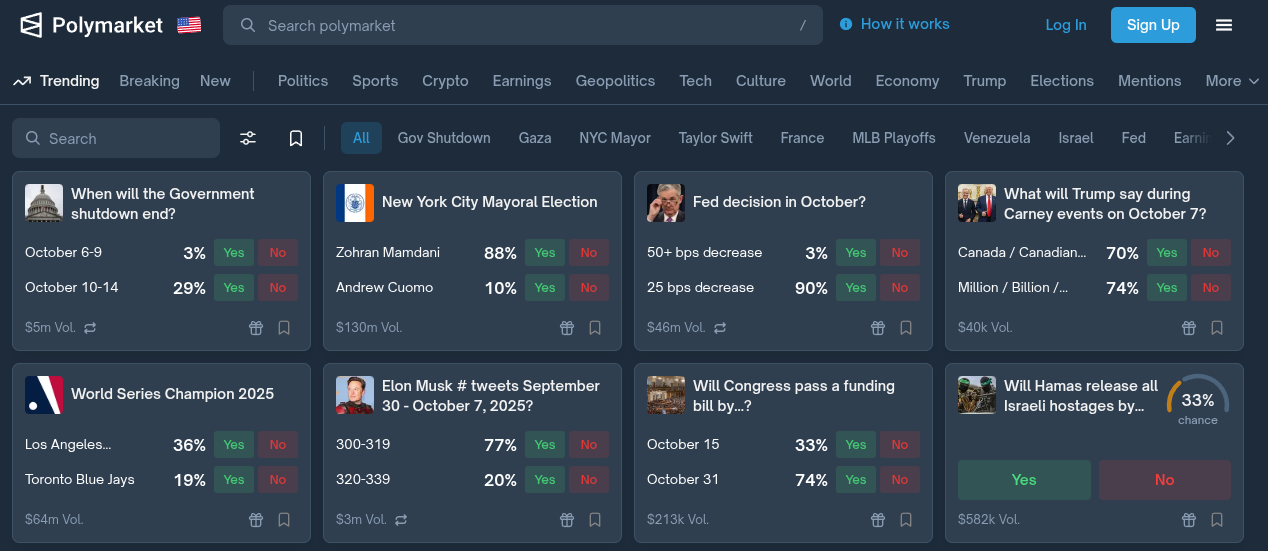
Polymarket operates on the premise of decentralized prediction markets, where users can speculate on the outcomes of real-world events. Participants buy and sell “shares” representing the probability of an event occurring. Settlement typically happens in stablecoins, and the markets are resolved based on verifiable data sources. Polymarket‘s user base is currently restricted in the United States due to regulatory considerations, yet the platform’s growth and potential have clearly captured ICE‘s attention.
The Traditional Finance Embrace: ICE‘s Crypto Strategy
ICE‘s investment is a bellwether for greater institutional involvement in the crypto space. The NYSE, the world’s largest stock exchange by market capitalization, boasting a valuation exceeding $25 trillion, demonstrates a clear desire to integrate the innovative potential of digital assets. This move could pave the way for similar investments by other major financial institutions, fostering further innovation and growth within the crypto ecosystem.
Regulatory Landscape and US Relaunch
The news follows reports that Polymarket is preparing for a US relaunch, potentially valuing the company as high as $10 billion. This US relaunch marks a pivotal moment in the company’s strategy, aiming to capture a larger audience within the established financial landscape. Interestingly, Polymarket has navigated a complex regulatory path. They recently obtained relief from reporting and record-keeping requirements from the US Commodity Futures Trading Commission (CFTC), representing a notable shift in attitude. This comes after previous scrutiny, including a cease-and-desist order in 2022 and an FBI raid. The acquisition of QCEX, a US-licensed derivatives exchange, further indicates a determined approach to comply with regulations.
Strategic Partnerships and Leadership Changes
Polymarket has also been making strategic moves. The inclusion of Donald Trump Jr. on its advisory board, along with a strategic investment from 1789 Capital, demonstrates its engagement with the evolving political and financial landscape. These developments could suggest a broader strategy for gaining traction and influence.
Implications and the Road Ahead
This massive investment by ICE could have several implications:
- Increased legitimacy for prediction markets.
- Greater institutional interest in crypto-related platforms.
- Potential for new financial instruments.
This could catalyze a new wave of innovation and participation in the crypto markets. The integration of traditional finance and the crypto world is undeniably gaining momentum. As Polymarket prepares to re-enter the US market, the future of prediction markets and their role within the wider financial landscape look promising.