

The Evolution of DEX Battles: Beyond Token Incentives
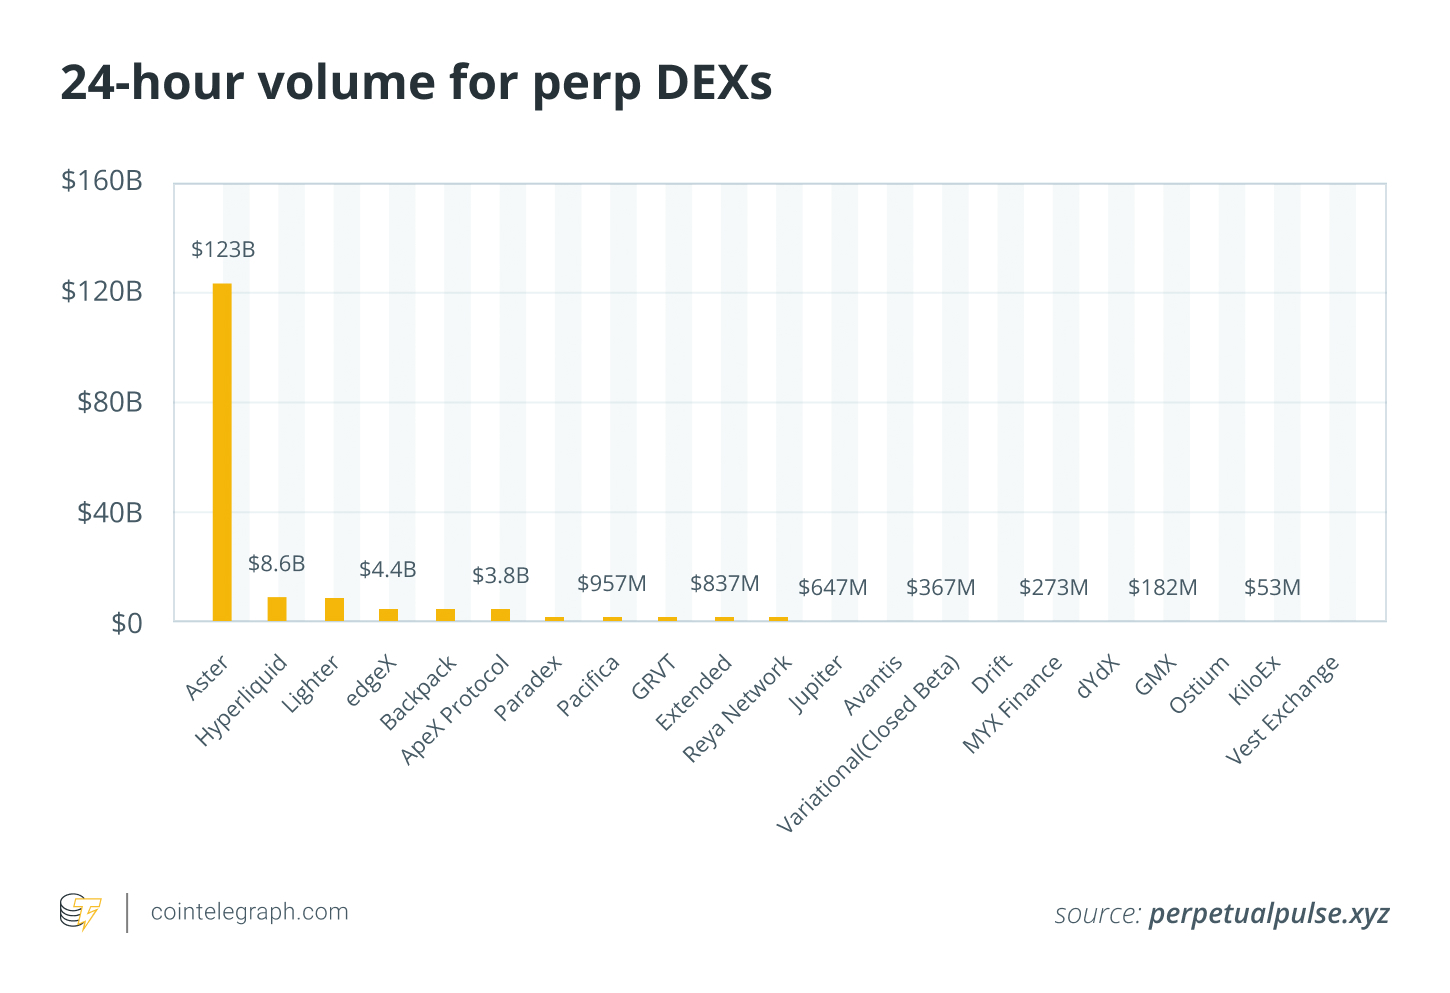
The decentralized exchange (DEX) landscape is undergoing a significant transformation. The initial era of DEXs, fueled by liquidity mining and token incentives, has given way to a new competition centered on speed, leverage, and infrastructure. This evolution is spearheaded by platforms like Hyperliquid, Aster, and Lighter, each vying for a slice of the burgeoning on-chain trading market. The focus has clearly shifted from simply attracting total value locked (TVL) to building robust, high-performance platforms that can cater to professional traders and institutional investors.
Hyperliquid‘s Dominance and Innovative Approaches
Hyperliquid has established itself as a leader in this new era. Its high-performance blockchain infrastructure, coupled with deep liquidity and fast execution, has made it a favorite among active traders. A points-based rewards program and a subsequent massive airdrop solidified its position, rewarding early adopters handsomely. The exchange’s commitment to innovation continues with the launch of HIP-3, which allows anyone to launch a perpetual DEX on Hyperliquid’s rails, the introduction of its USDH stablecoin, and plans to list perpetuals for rival tokens like ASTER to capture narrative-driven flows. Further cementing its community, the Hypurr NFT collection has captured significant attention, fueling speculation about future reward rounds.
Aster: Leverage and Narrative-Driven Growth
Aster, a DEX built on BNB Smart Chain, is quickly emerging as a key competitor. Its connection to Binance, and its founder Changpeng Zhao (CZ), has significantly boosted its visibility and credibility within the crypto community. Aster‘s strategy involves high leverage and tokenized stocks, attracting professional traders. Their aggressive airdrop program, which rewards users for trading activity, has fueled substantial trading volume and a growing presence in the top revenue earners in DeFi. There’s even speculation that Aster may use profits to buyback tokens, potentially enhancing its value.
Lighter: Speed and the Lure of the Points
Lighter is making waves with its custom Ethereum layer-2, zero-knowledge circuits, and sub-five-millisecond matching latency. The platform offers zero trading fees to retail users and premium charges for API and institutional flows. Lighter‘s strategy revolves around speed and a unique points-based system, notably through the Lighter Liquidity Pool (LLP), which provides high annual percentage yield (APY) on deposits. The anticipation surrounding Lighter‘s potential token launch has created an active over-the-counter market for Lighter points, reflecting the high level of interest and speculative fervor surrounding the project.
Institutional Adoption and the Future of DEXs
A key trend shaping the future of DEXs is the growing involvement of institutional liquidity. Funds that once avoided on-chain derivatives are now allocating capital to these platforms. The appeal lies in features like speed, transparency, and reduced counterparty risk. As the competition intensifies, the long-term success of each platform may depend on their capacity to provide reliable infrastructure and attract serious capital. The coming months will reveal whether incentive-driven approaches or robust infrastructure will ultimately win the battle for dominance in the on-chain derivatives market.