The $68,000 Line in the Sand: Bitcoin‘s Key Support
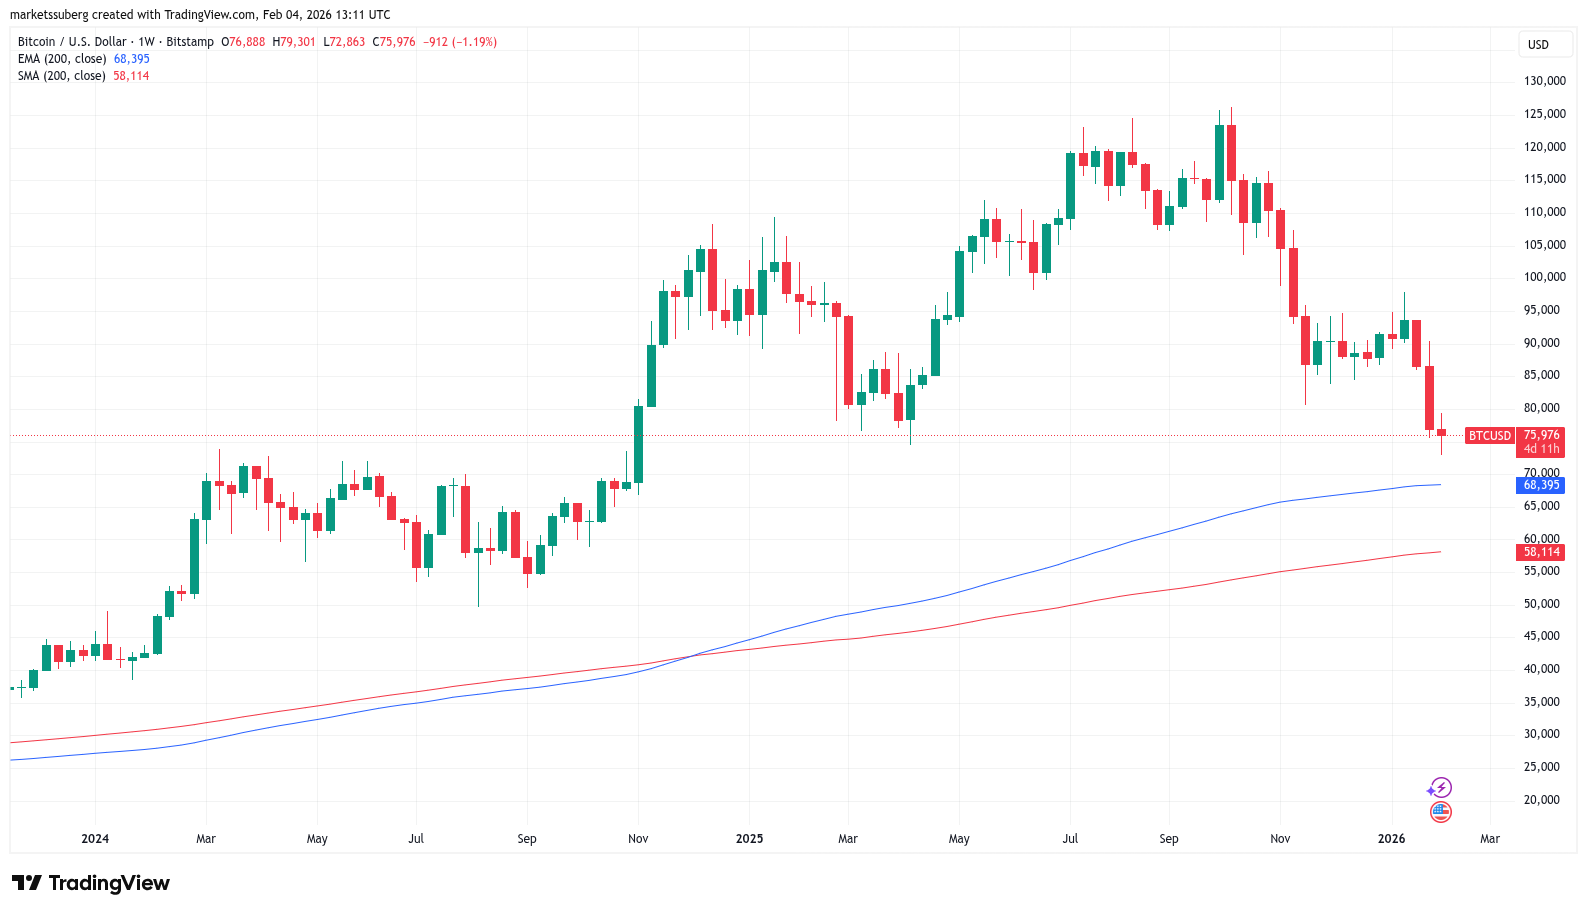
Bitcoin is currently navigating a period of heightened volatility, with traders closely watching a crucial technical level: the 200-week exponential moving average (EMA), currently hovering around $68,000. This key trendline, a significant metric for long-term investors, is now being touted by several analysts as a potential bottom for the current price correction. The 200-week EMA has historically acted as a reliable support level, offering a potential cushion against further price declines.

Navigating the Market Dip: Trader Perspectives
Following a recent period of downward price action, the Bitcoin market has witnessed a surge in bearish sentiment. Despite this, many traders are turning to historical data and technical indicators to gauge the likelihood of a price rebound. Key figures in the analysis point towards the 200-week EMA as a critical area of interest. According to some market observers, a test of the 200-week EMA could signal a buying opportunity, setting the stage for a potential long-term accumulation phase.
The Technical Underpinnings: EMA vs. SMA
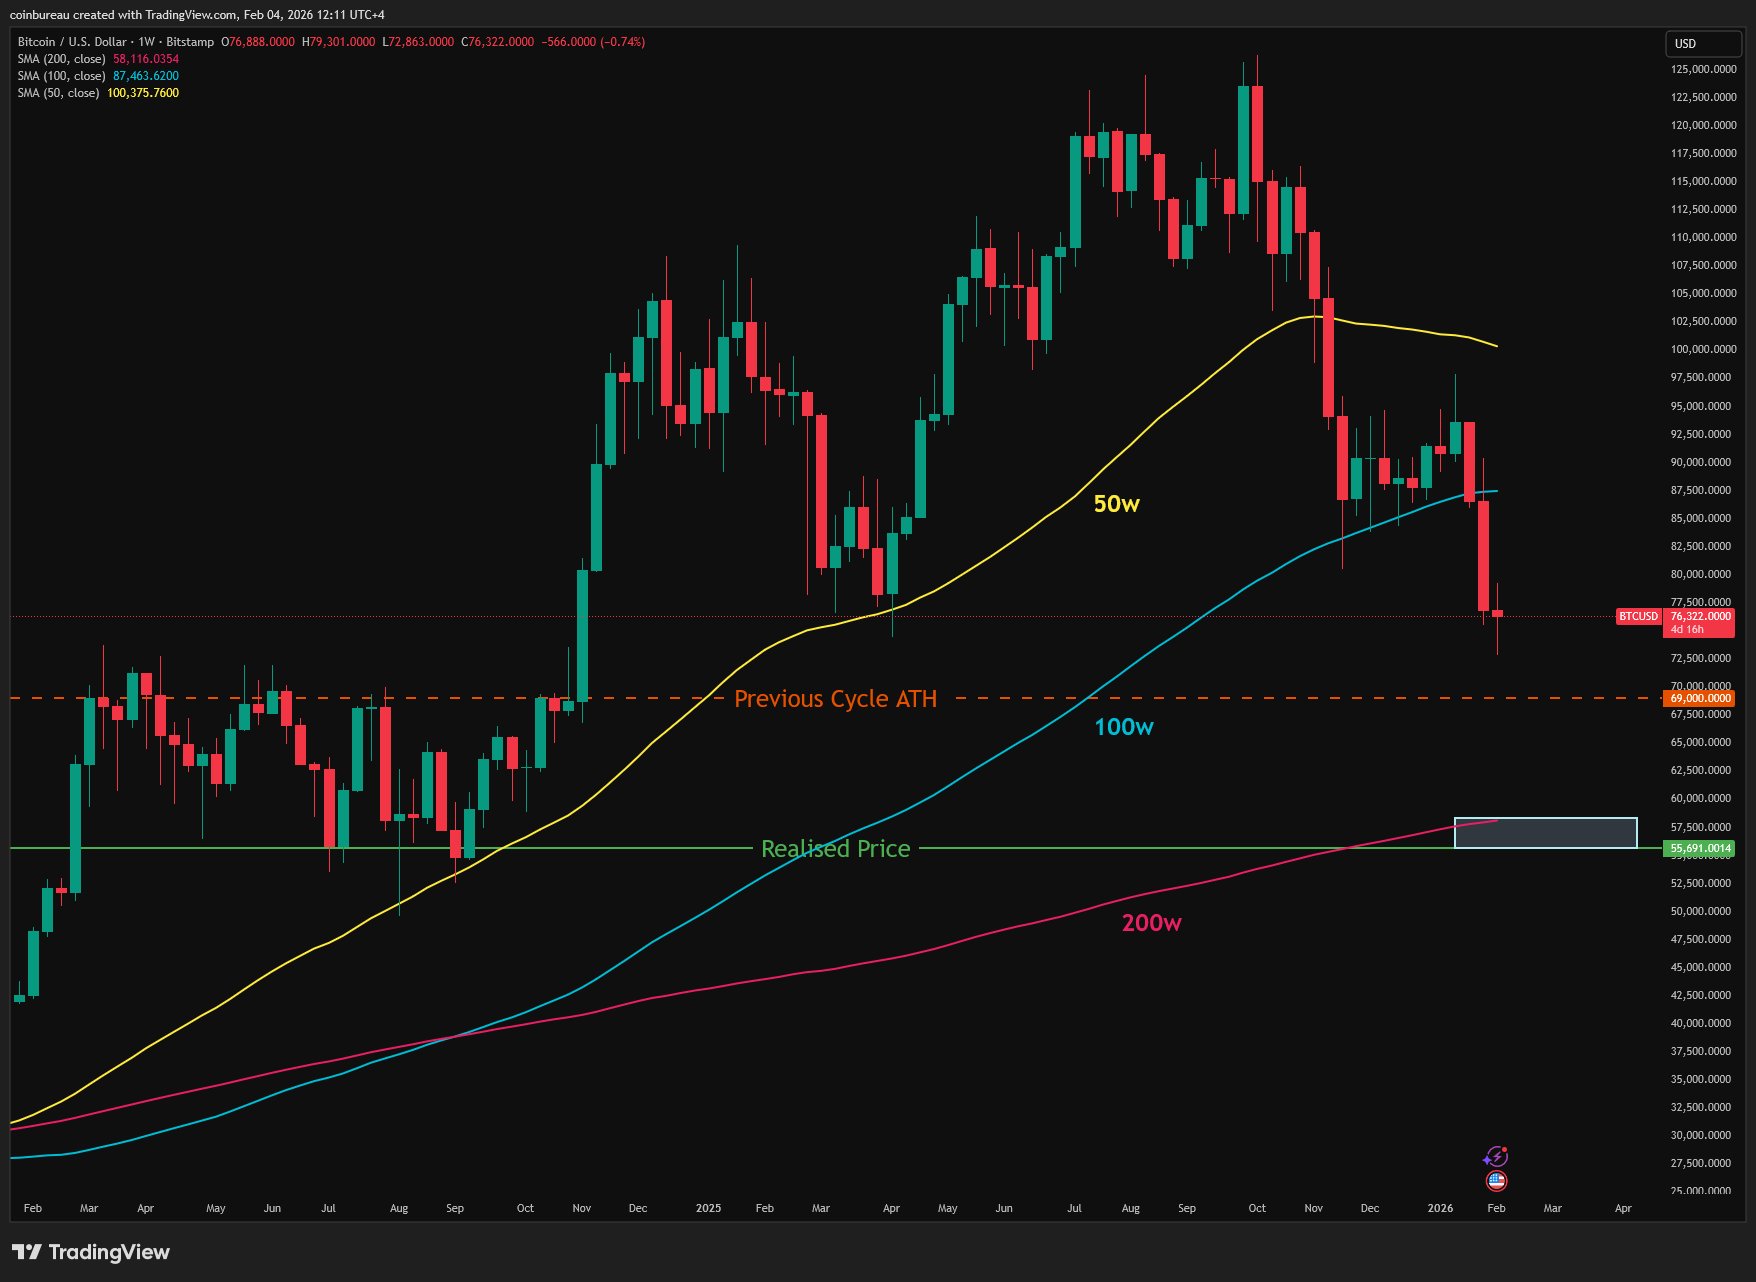
The 200-week EMA isn’t the only moving average attracting attention. The 200-week simple moving average (SMA) is also being monitored, forming a broad support band alongside the EMA. Understanding the difference is crucial: the EMA places more weight on recent price data, making it potentially more responsive to current market conditions. The SMA, on the other hand, provides a more smoothed view of price trends over a longer period. Both, however, are considered significant support indicators.
Market Sentiment and Investor Behavior
The current market environment is characterized by a mix of fear and opportunity. While recent price drops have triggered concern among some investors, others view the situation as a chance to accumulate Bitcoin at a discounted price. This divergence in sentiment is a common occurrence during market corrections and can often foreshadow a potential trend reversal. Retail investors, as well as institutional players, are closely watching the $68,000 level. Net outflows from US spot Bitcoin ETFs, though present, are still a relatively small percentage of their total assets under management, demonstrating a degree of resilience.
Looking Ahead: Potential Scenarios
Several possible outcomes are now being debated within the crypto community. Some analysts anticipate a direct bounce off the 200-week EMA, while others suggest a potential dip below this level before a recovery. Regardless of the short-term fluctuations, the prevailing view is that the $68,000 mark presents a pivotal moment for Bitcoin. The outcome will depend on numerous factors, including overall market sentiment, inflows from institutional investors, and any significant shifts in regulatory landscape. The 200-week EMA is the point that traders are watching to determine the path forward.
Disclaimer
This article is for informational purposes only and should not be considered as financial advice. Cryptocurrency investments are subject to market volatility and risk. Always conduct your own thorough research before making any trading or investment decisions.