

Bitcoin Soars Above $105,000: A Bullish Upward Trajectory?
Bitcoin (BTC) embarked on a triumphant rally, exceeding $105,000 and solidifying its position as the dominant cryptocurrency. This upward trajectory has been fueled by a confluence of factors, including robust institutional demand, surging futures market activity, and a compelling technical pattern suggesting further gains.
Institutional Appetite Propels Bitcoin Higher
The recent upswing in Bitcoin’s price coincides with a marked increase in institutional capital flowing into the crypto space. Data from Farside Investors reveals that spot Bitcoin exchange-traded funds (ETFs) have witnessed inflows for 18 out of the past 21 days, amassing a staggering $6.9 billion in new capital within three weeks. This consistent inflow underscores the growing interest of institutional investors seeking regulated exposure to Bitcoin.
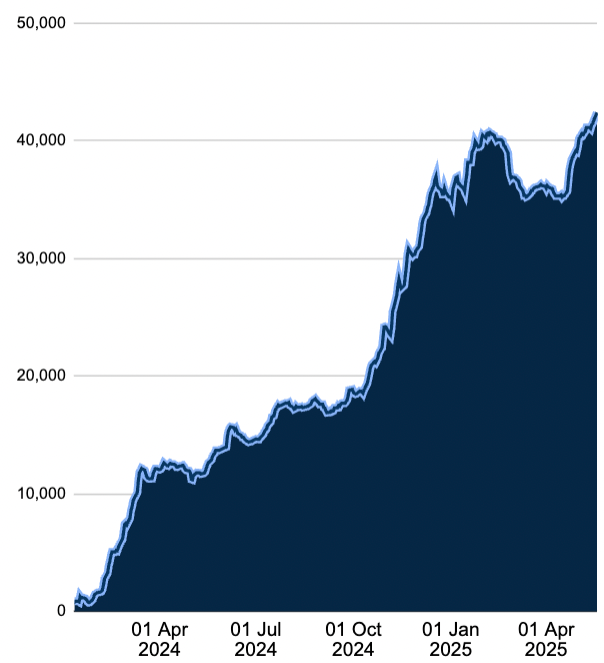
CoinShares, a leading digital asset investment firm, corroborates this trend, highlighting that institutional investors pumped $785 million into crypto investment products over the past week, marking a five-week streak of inflows. Bitcoin investment products were the beneficiaries of $557 million of these inflows, signifying increasing confidence in the digital asset as a long-term investment.
Moreover, corporate giants are also expressing unwavering support for Bitcoin. Strategy, formerly known as MicroStrategy, the leading corporate Bitcoin holder, recently acquired 7,390 BTC, worth approximately $765 million. Meanwhile, Japan’s Metaplanet, a digital asset platform, added 1,004 BTC to its holdings, signifying their bullish outlook on Bitcoin’s future.
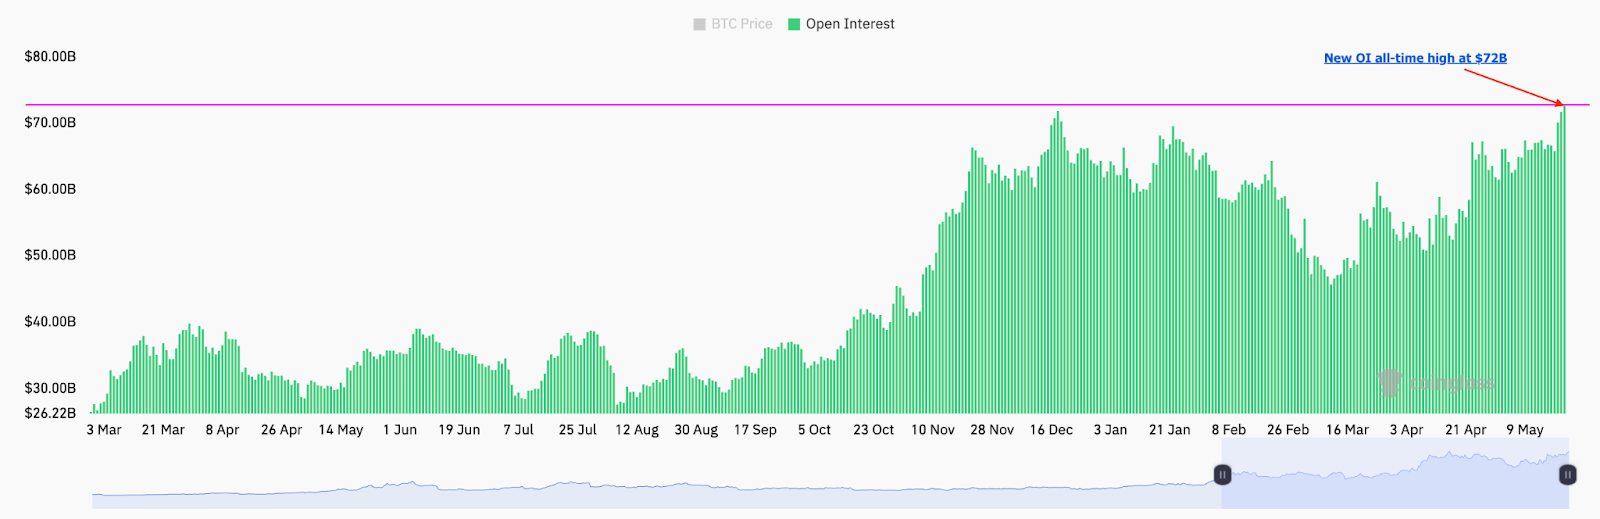
Futures Market Frenzy: Open Interest Reaches All-Time Highs
The futures market is another key driver behind Bitcoin’s recent climb. Data from CoinGlass shows that Bitcoin’s total open interest (OI) in the derivatives market reached an all-time high of $72.63 billion on May 20, up from $57.1 billion on April 19. This significant jump, representing a 27% increase in the past 30 days, indicates a surge in demand for leveraged BTC positions.
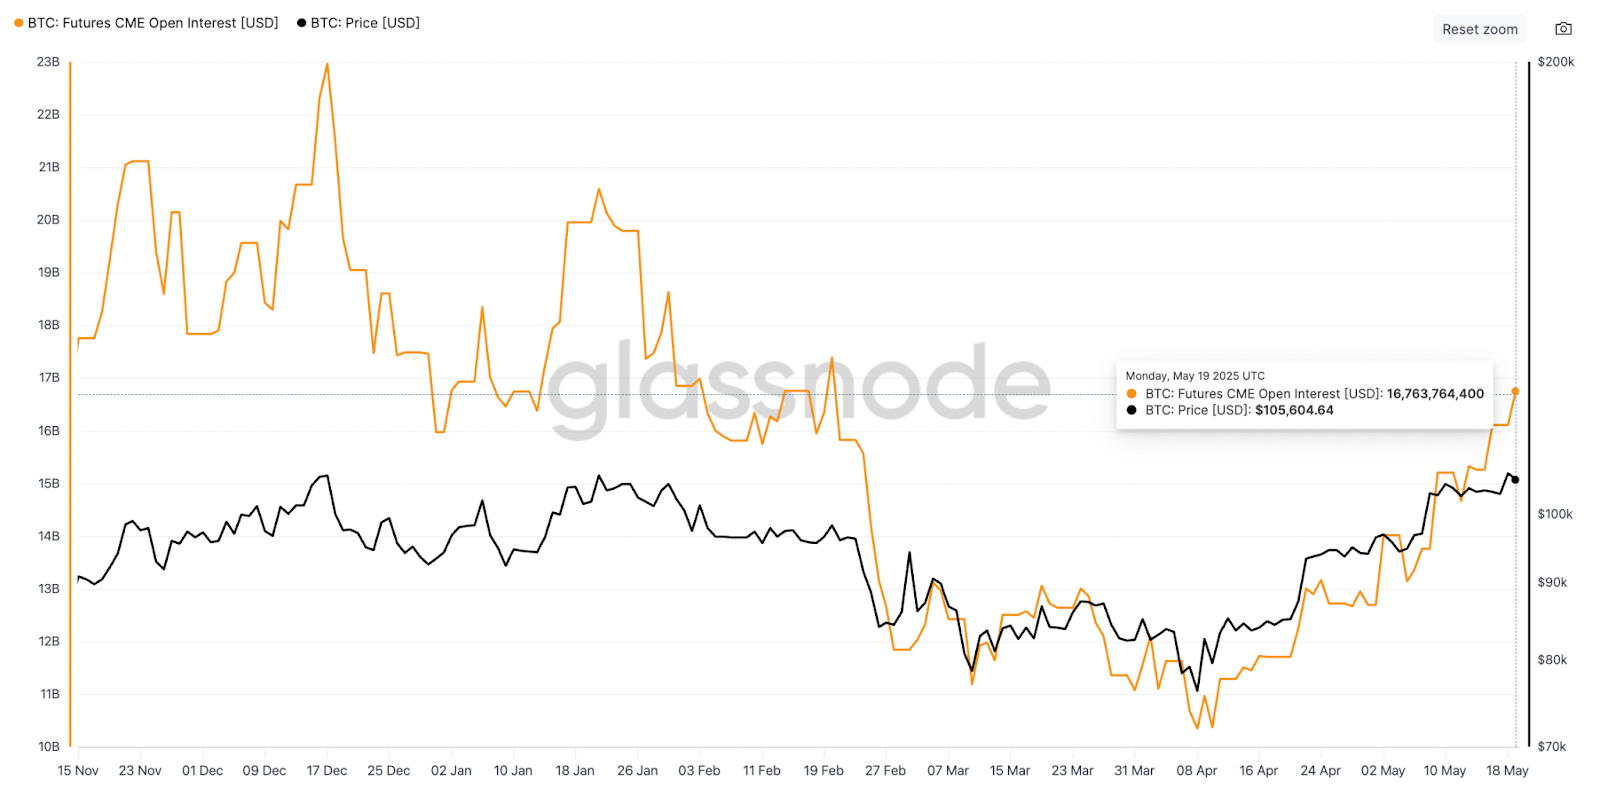
Further supporting this trend, Bitcoin CME futures OI also hit a 90-day high of 157,875 BTC on May 19, equivalent to approximately $16.76 billion at the time. This heightened activity in the CME futures market suggests that investors are expecting Bitcoin to continue its uptrend, potentially mirroring the remarkable 84% rally witnessed between late October 2024 and December 2024, when rising OI accompanied BTC’s ascent to its previous all-time highs.
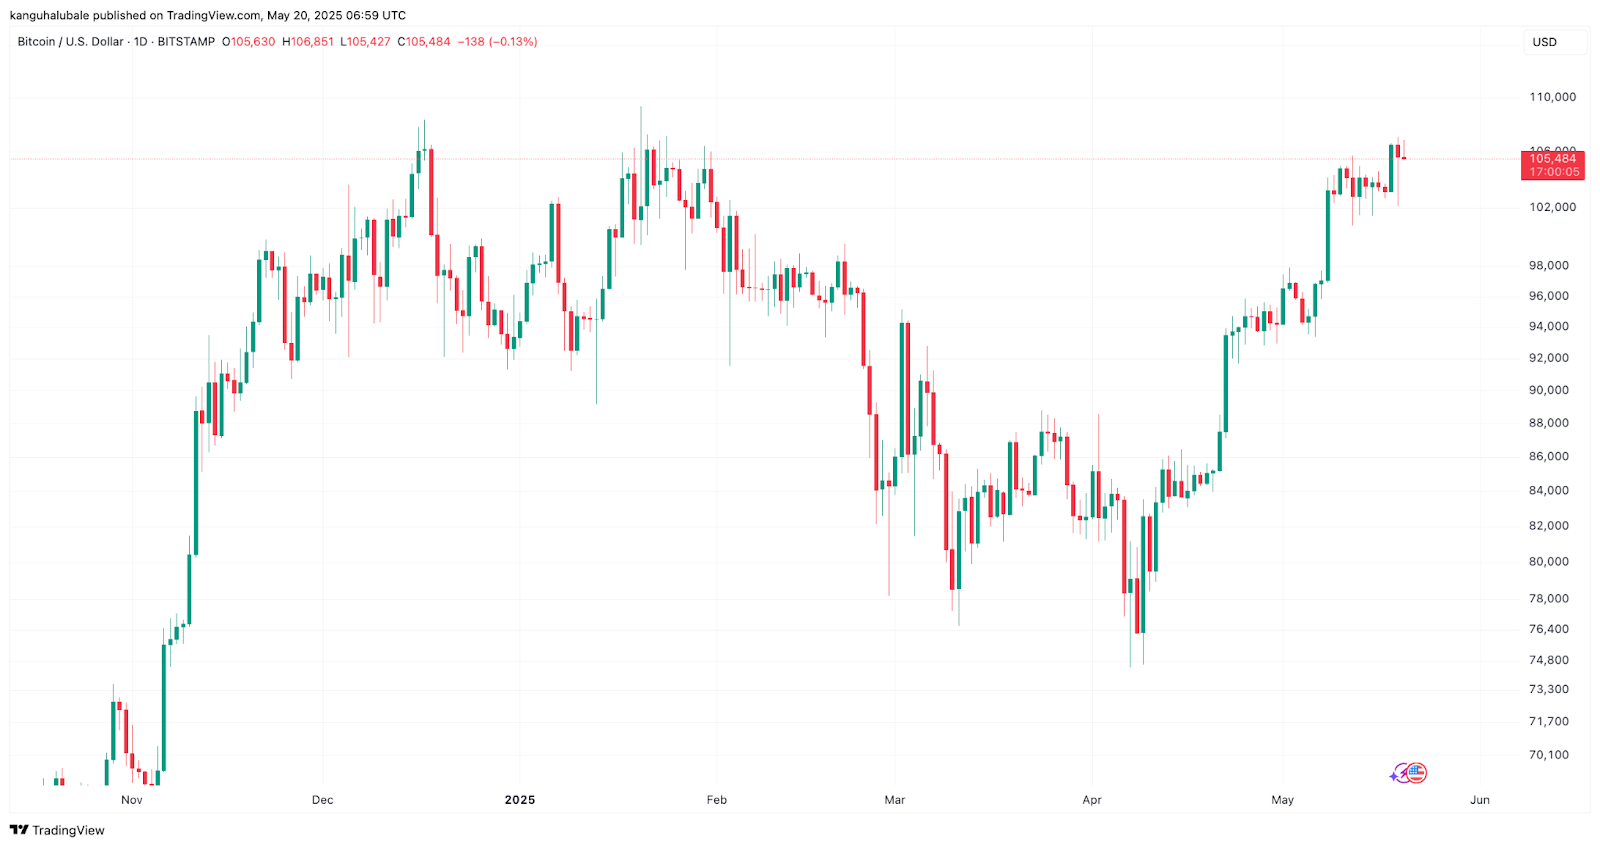
Technical Analysis: A Cup-and-Handle Pattern Points to $138,000
From a technical perspective, the BTC/USD pair has been forming a classic cup-and-handle chart pattern on its daily chart since December 17, 2024. This bullish pattern emerges when a price decline is followed by a steady recovery in a U-shaped pattern, known as the cup. Subsequently, the price experiences a pullback, forming a descending channel that resembles a handle. The pattern concludes when the price breaks above the handle, signaling a potential surge to a target price that roughly equals the initial decline.
Currently, Bitcoin is trading above the handle range, approaching a break above the neckline resistance at $106,000. A decisive daily candlestick close above the neckline could pave the way for Bitcoin to confront resistance from its previous all-time high near $109,000. A successful breakthrough of this barrier could open the door to the technical target of the prevailing chart pattern, reaching $138,000, representing a potential 31% gain from current levels.
While technical patterns offer valuable insights, it’s crucial to remember that they don’t guarantee future price movements. Market sentiment, economic factors, and unexpected events can influence Bitcoin’s trajectory. Therefore, always conduct thorough research and consult with financial professionals before making any investment decisions.