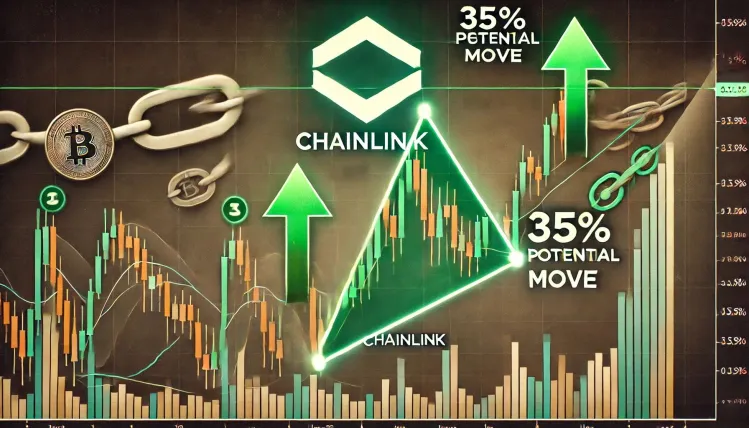
Chainlink (LINK) has been trading in a tight consolidation phase, forming a symmetrical triangle pattern on the charts. This setup often precedes a significant breakout, and analysts suggest that LINK could be on the verge of a 35% price move—but the big question remains: Will it break to the upside or downside?
As Chainlink hovers near a critical point in its pattern, investors are closely watching for confirmation. Let’s break down the technical analysis, market sentiment, and possible price targets for LINK in the coming days.
The Triangle Pattern: What It Means for Chainlink
A symmetrical triangle forms when an asset’s price gets squeezed between lower highs and higher lows, indicating a battle between buyers and sellers. This type of pattern typically leads to a strong breakout in either direction once price action nears the apex.
🔹 Chainlink’s Current Setup:
- LINK has been consolidating between $13.50 and $17.00, creating a tightening price range.
- Trading volume is declining, which often precedes an explosive move.
- The resistance line of the triangle sits near $17.00, while support lies around $14.00.
If Chainlink breaks above resistance, we could see a massive surge of up to 35%, targeting $22.50 and beyond. However, if bears take control, a breakdown below $14.00 could send LINK back toward $10-$11 levels.
Bullish Case: Why Chainlink Could Break Out Upward 🚀
Several key factors suggest that Chainlink is poised for an upside breakout:
1️⃣ Strong On-Chain Metrics
📈 Increased whale accumulation – Large investors are adding LINK to their portfolios, signaling confidence.
💰 Rising staking participation – More users are locking up LINK, reducing circulating supply.
2️⃣ Growing Chainlink Adoption
Chainlink’s oracle technology is a backbone for DeFi, NFTs, and smart contracts, with continued partnerships fueling long-term demand. Recent collaborations with major blockchain projects could further boost investor sentiment.
3️⃣ Bullish Market Conditions
If Bitcoin and Ethereum continue their uptrend, Chainlink could ride the altcoin rally and break above resistance, triggering a rapid move to $22.
Bearish Case: Could Chainlink Break Down Instead? 📉
Despite the bullish setup, a downside move is still possible if market conditions shift.
1️⃣ Weak Trading Volume
A lack of strong buying momentum could cause LINK to struggle at resistance, leading to a bearish rejection.
2️⃣ Overall Crypto Market Weakness
If Bitcoin faces a correction or broader macroeconomic concerns arise, altcoins like LINK could suffer, leading to a potential breakdown toward $10-$12.
3️⃣ Failure to Hold Key Support
If LINK breaks below the $14.00 support level, selling pressure could intensify, confirming a bearish breakdown from the triangle pattern.
What’s Next for Chainlink? Price Targets 📊
🔵 Bullish Breakout Target: A confirmed breakout above $17.00 could send LINK toward $22.50-$23.00, a 35% gain from current levels.
🔴 Bearish Breakdown Target: A drop below $14.00 could see LINK fall back to $10-$11, erasing recent gains.
📍 Traders should watch for:
✅ A decisive move above or below the triangle pattern
✅ High volume confirmation—a breakout with weak volume could be a fakeout
✅ Bitcoin’s movement, as it often dictates overall altcoin momentum
With Chainlink approaching a crucial moment, a breakout seems inevitable—but will it be to the upside or downside? Only time will tell.
Final Thoughts
Chainlink’s symmetrical triangle pattern is reaching its final stages, and a major 35% breakout is likely imminent. Whether LINK explodes toward $22+ or tumbles toward $10 depends on key resistance and support levels, market sentiment, and external crypto trends.
For traders, this is a make-or-break moment for LINK—will the bulls take control, or are the bears lurking?


