

2025: A Year of Shifting Sands in the Blockchain Ecosystem
The year 2025 presented a dynamic picture across the crypto landscape. On-chain metrics, a crucial indicator of network health and adoption, experienced significant shifts, with some blockchains witnessing steep declines in active addresses and transaction volumes. This volatility underscores the rapidly evolving nature of the industry, where trends can change dramatically in short periods. The data, primarily sourced from Nansen, highlights a period of flux, driven by factors like application migrations, airdrop fatigue, and the ebb and flow of user interest in various projects.
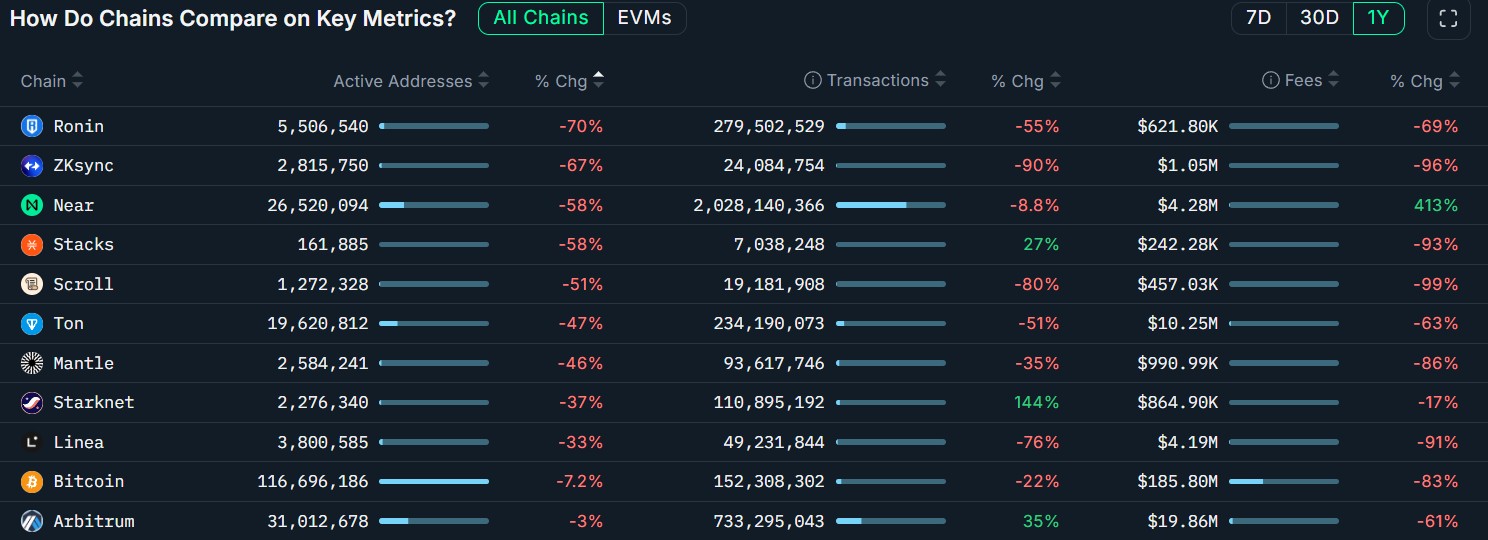
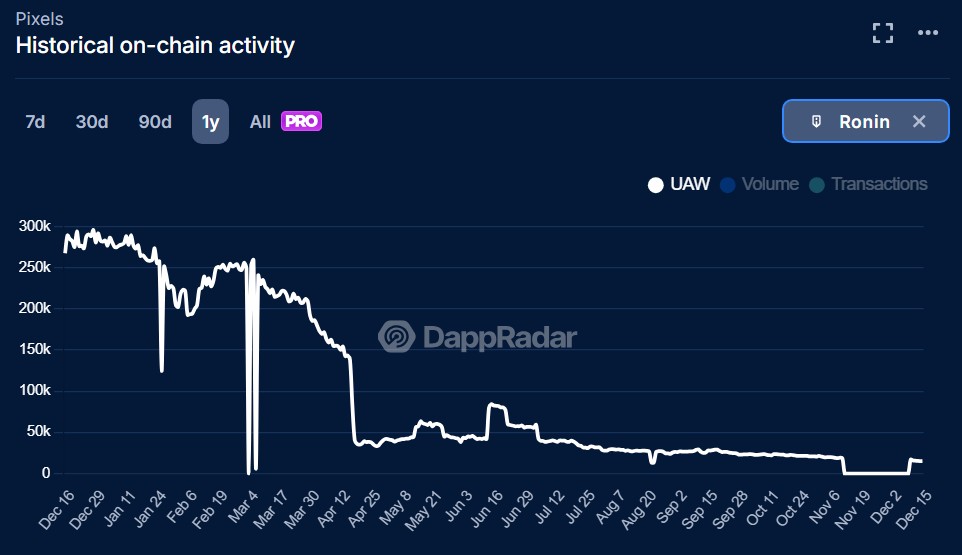
Ronin and ZKsync Lead the Downturn
Among the most notable shifts, the Ronin network, initially propelled by the popularity of the game Pixels, saw a substantial 70% decrease in active addresses. Pixels’ migration from Polygon initially drove a surge in activity, temporarily making Ronin a top contender. However, as the game’s popularity waned, so did Ronin‘s on-chain engagement, illustrating the dependency on individual applications. Similarly, ZKsync, an Ethereum layer-2 network, experienced a sharp downturn, with transaction volume declining by a staggering 90%. This decline followed the network’s token airdrop, with a significant percentage of eligible wallets immediately selling their allocations. This phenomenon emphasizes the impact of airdrops in driving initial adoption but also the potential for unsustainable, speculative activity.
Ethereum‘s Contrasting Performance and Layer-2 Dynamics
While some Ethereum layer-2 networks struggled, Ethereum‘s base layer showed resilience, recording a 25% increase in active addresses and a more than 20% rise in transactions. This contrasting performance underscores the complex interplay between the base layer and its scaling solutions. The ongoing debate around Ethereum‘s rollup-centric roadmap and concerns regarding liquidity fragmentation across layer-2 networks further complicate the narrative. Layer-2 networks like Arbitrum saw moderate declines in active addresses, but still maintained a large user base. Others like Base and Optimism bucked the trend, demonstrating growth. These discrepancies highlight the varied success of different scaling solutions in attracting and retaining users.
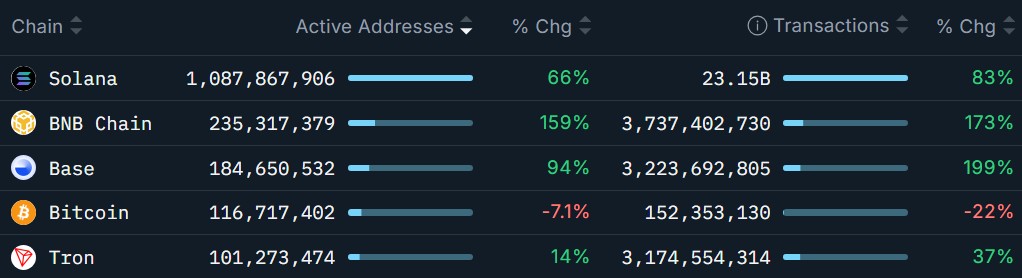
The Bitcoin Factor and Ecosystem Comparisons
Bitcoin‘s performance also made headlines, registering a 7.2% decline in active addresses. However, it’s worth noting that the network saw a 22% drop in transactions, with onchain activity declining across several other networks. Meanwhile, Solana and BNB Chain demonstrated noteworthy growth in active addresses. Solana, in particular, maintained a strong position due to sustained adoption beyond memecoin-driven surges. BNB Chain, supported by its association with Binance, saw a significant increase in active addresses. The varying fortunes of these networks exemplify the diverse landscape of the cryptocurrency market, with each blockchain having its unique drivers of activity and user behavior.
What These Declines Really Mean
The data suggests that year-over-year declines don’t always reflect systemic failures. On-chain activity swings can be heavily influenced by application migrations, incentive programs, and the short-lived nature of viral trends. Networks that demonstrated an ability to retain users and build an ecosystem beyond these initial surges, like Solana and Base, seem better positioned for long-term growth. The data underscores the importance of looking beyond raw numbers to understand the underlying trends and the shifting dynamics of the blockchain world. Investors and users should consider this volatility when assessing future opportunities.
Understanding these shifts is key to navigating the ever-changing crypto market.