Bitcoin’s Price Consolidation: Bull Flag or Pullback?
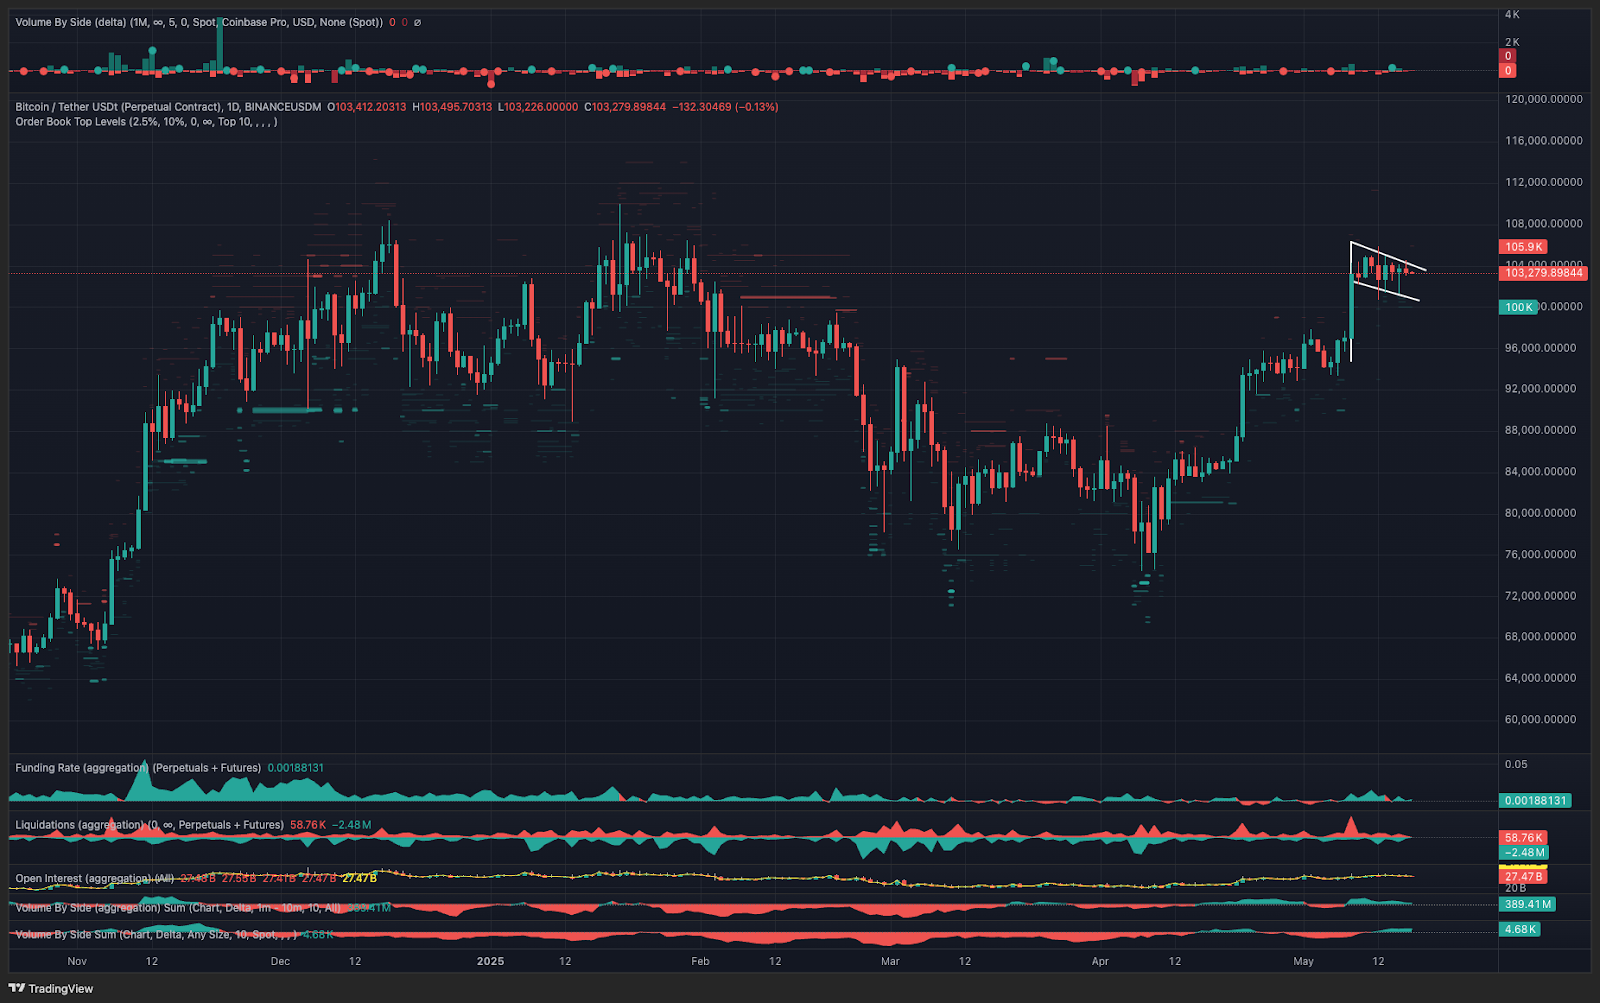
Bitcoin’s (BTC) price has been hovering around the $104,000 to $105,000 range for much of the week, prompting analysts to dissect the market’s movements. While some see this as a resistance zone, others argue that Bitcoin is consolidating within a bullish technical pattern known as a bull flag.
A bull flag is a continuation pattern that often follows a strong upward trend. It’s characterized by a period of sideways price action within a defined range, creating a flag-like shape on the chart. The theory is that when Bitcoin breaks out of the flag’s trendline resistance, the uptrend resumes.
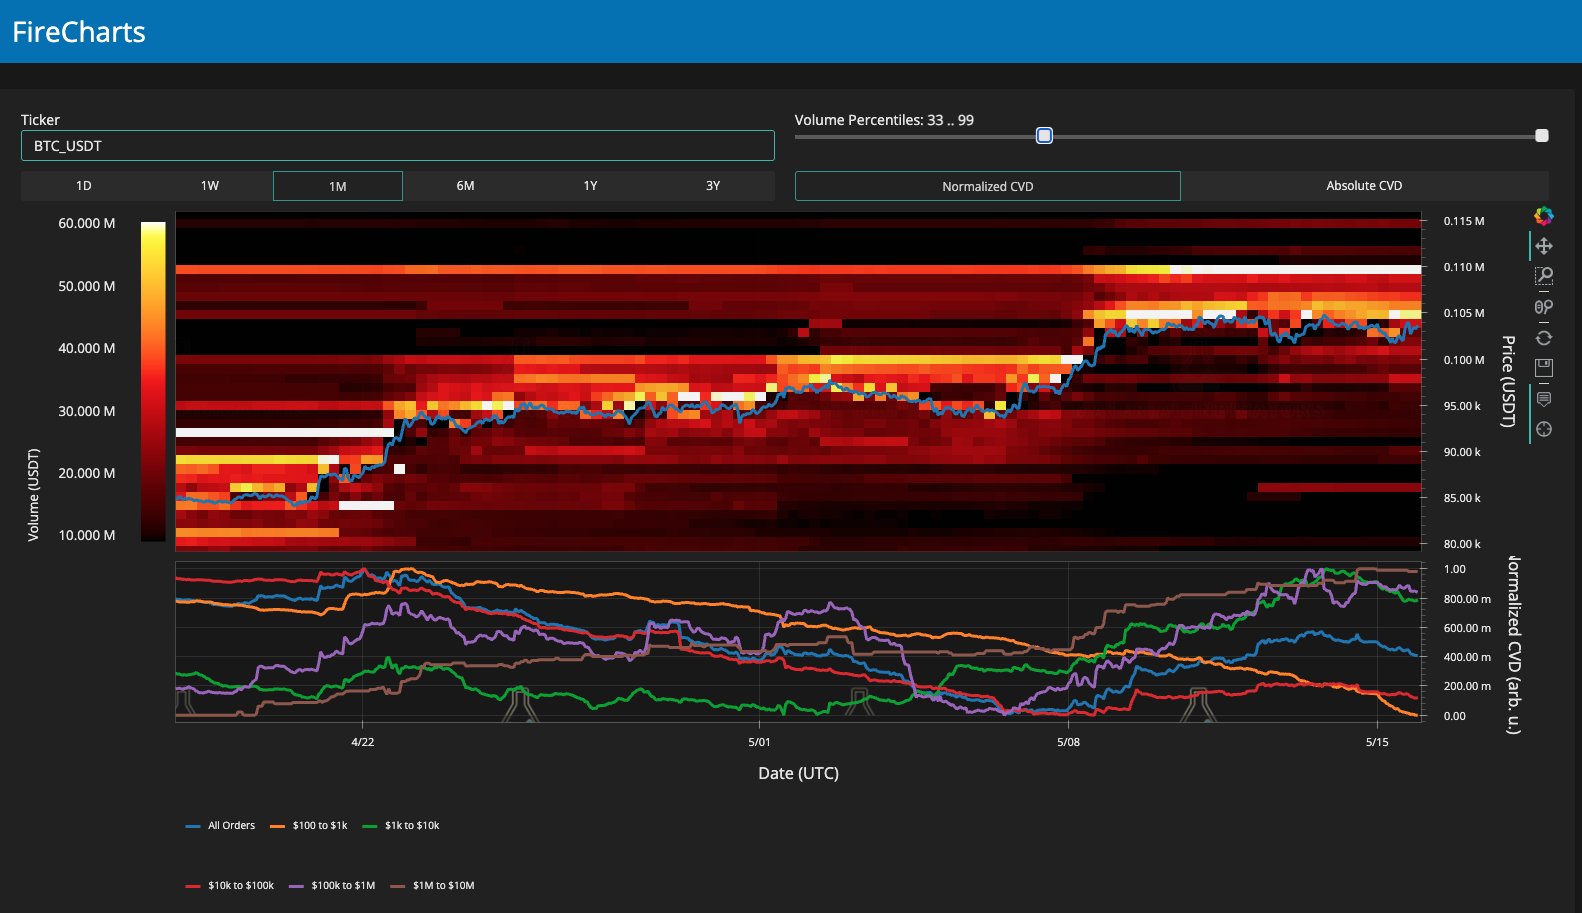
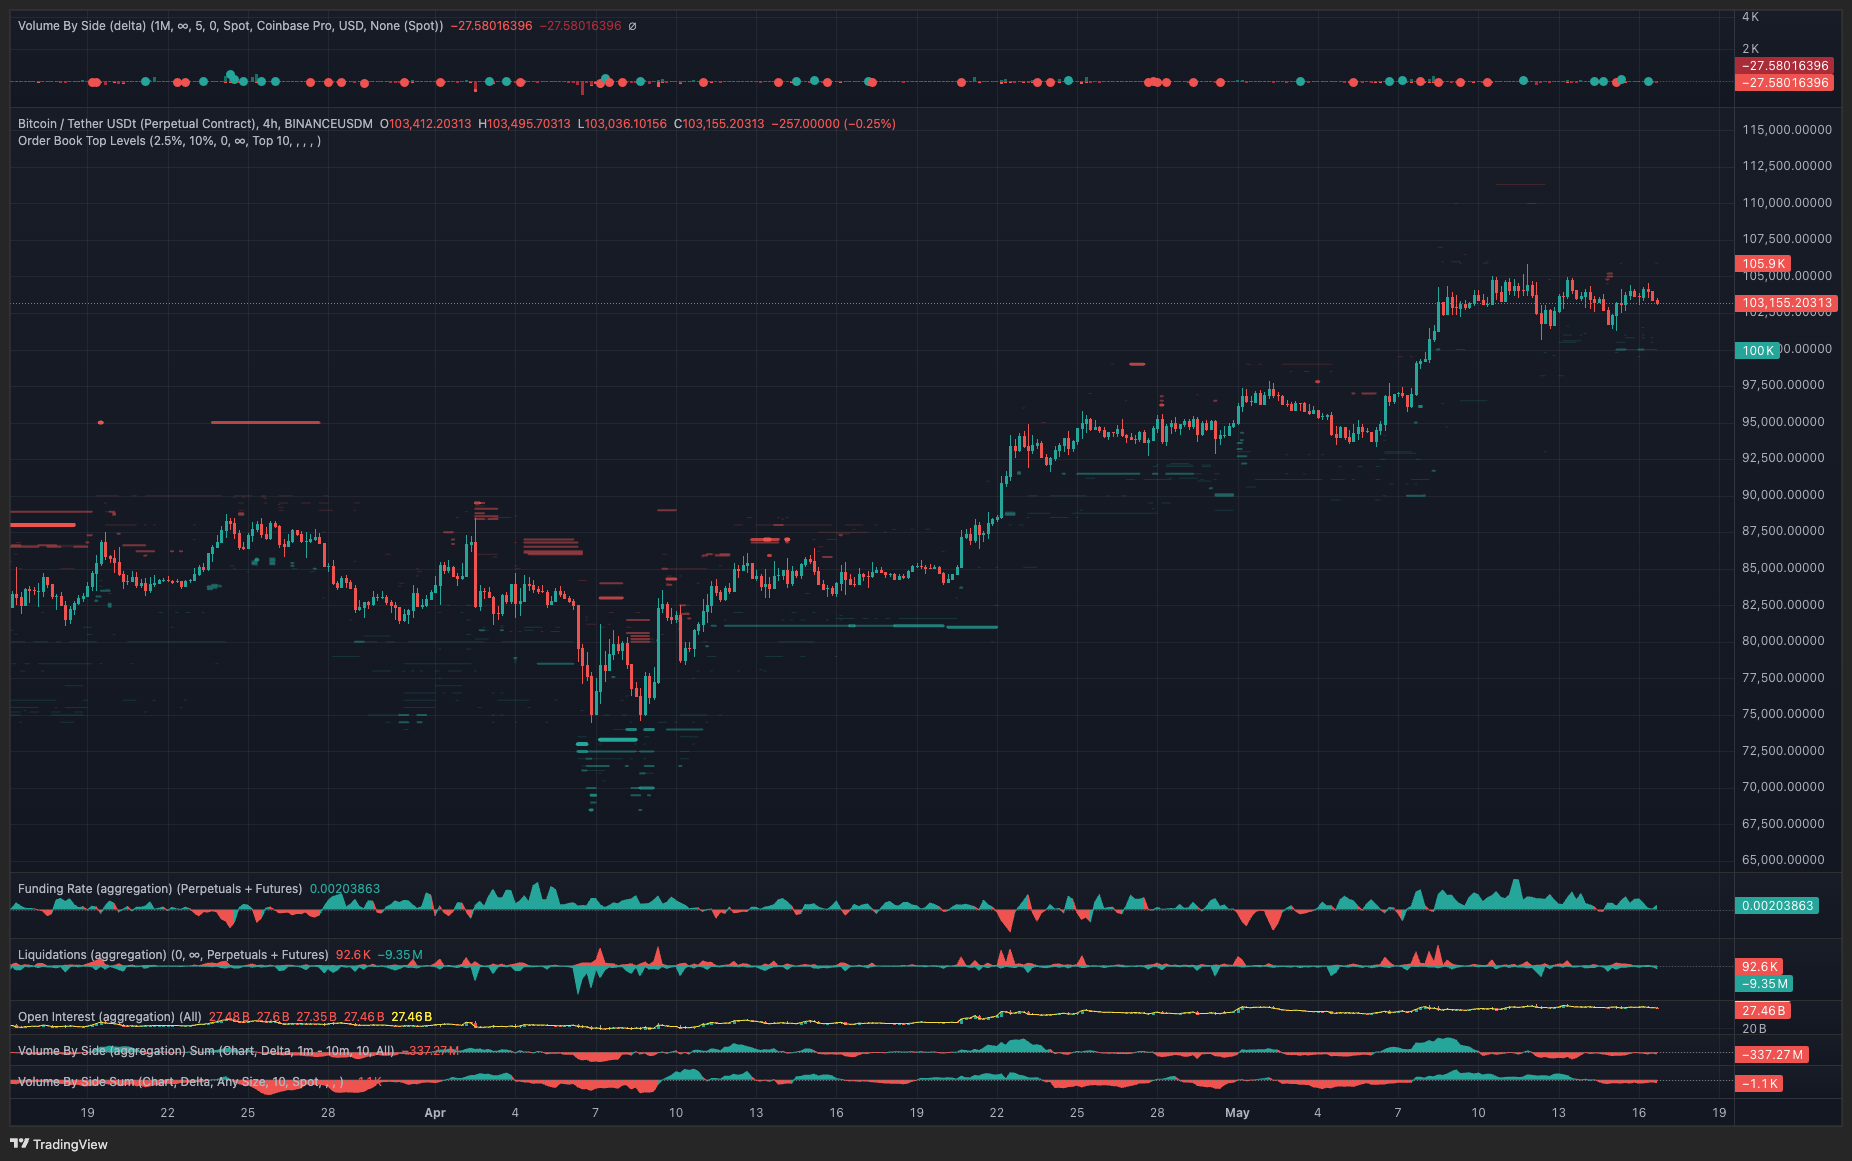
The lack of strong buy volume is a key factor fueling the consolidation. While some analysts interpret this as a sign of indecision, others see it as a reflection of the recent surge in Bitcoin’s price, where large liquidations and robust spot volumes accompanied the rally from $74,400 to $105,900. This surge was fueled by institutional interest, evidenced by large spot Bitcoin ETF inflows and announcements from companies establishing Bitcoin treasuries.
On-Chain Data Supports Profit Taking, but Bullish Sentiment Remains
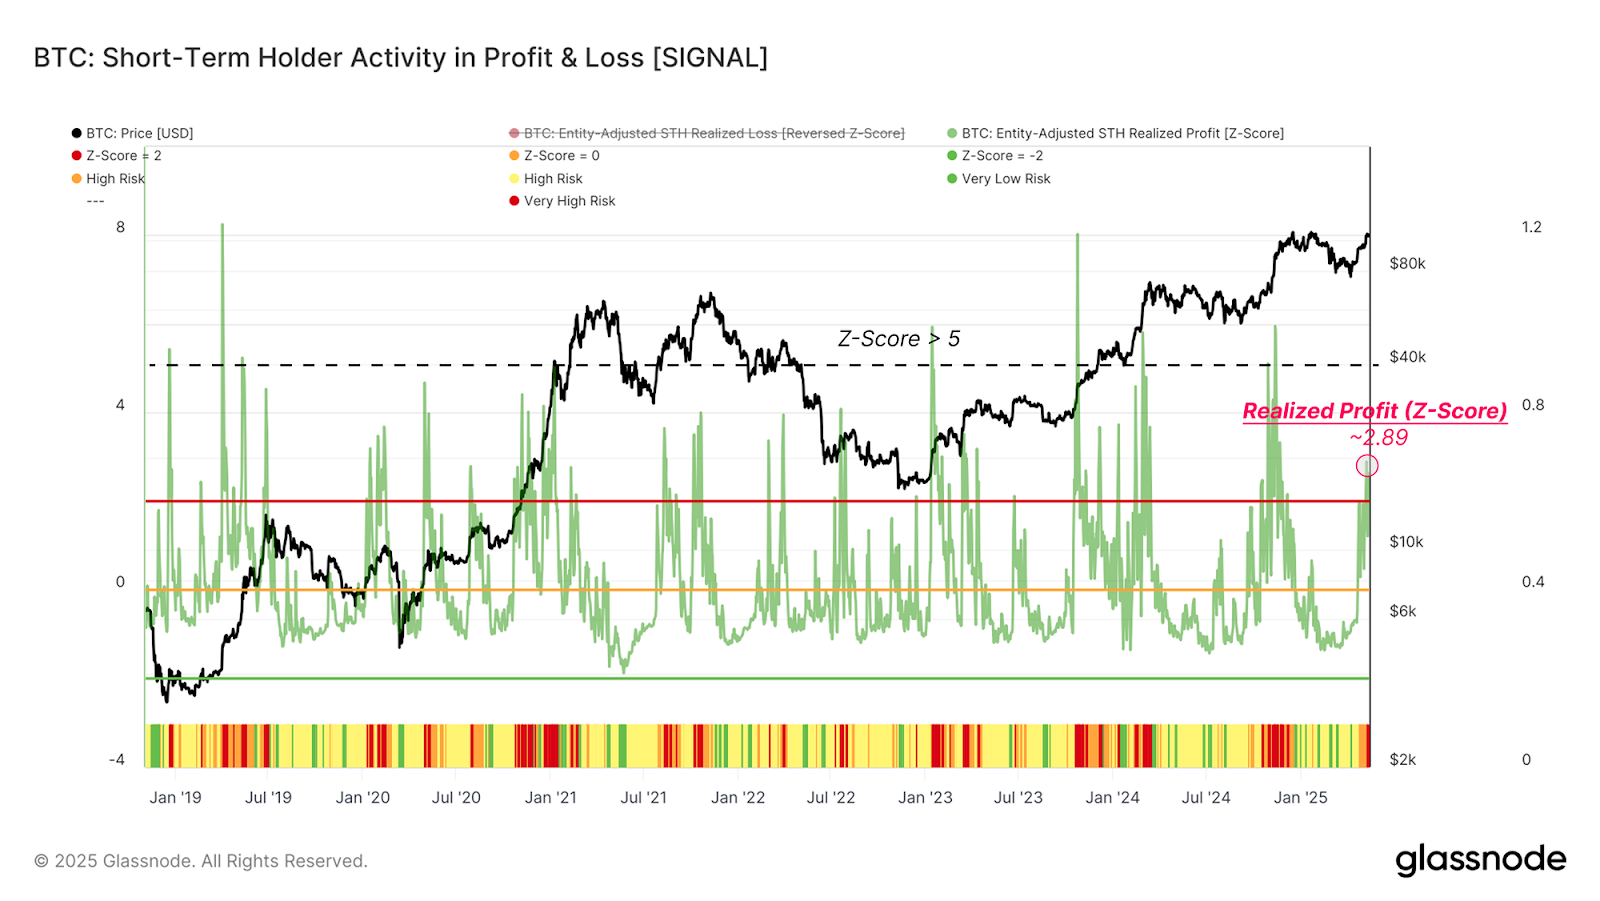
Data from Glassnode suggests that the recent profit-taking observed in the Bitcoin market is a normal phenomenon after a significant price rally. Short-term holder realized profits have surged, but they remain below historical highs, indicating that the current profit-taking pressure is not strong enough to derail the broader bullish trend.
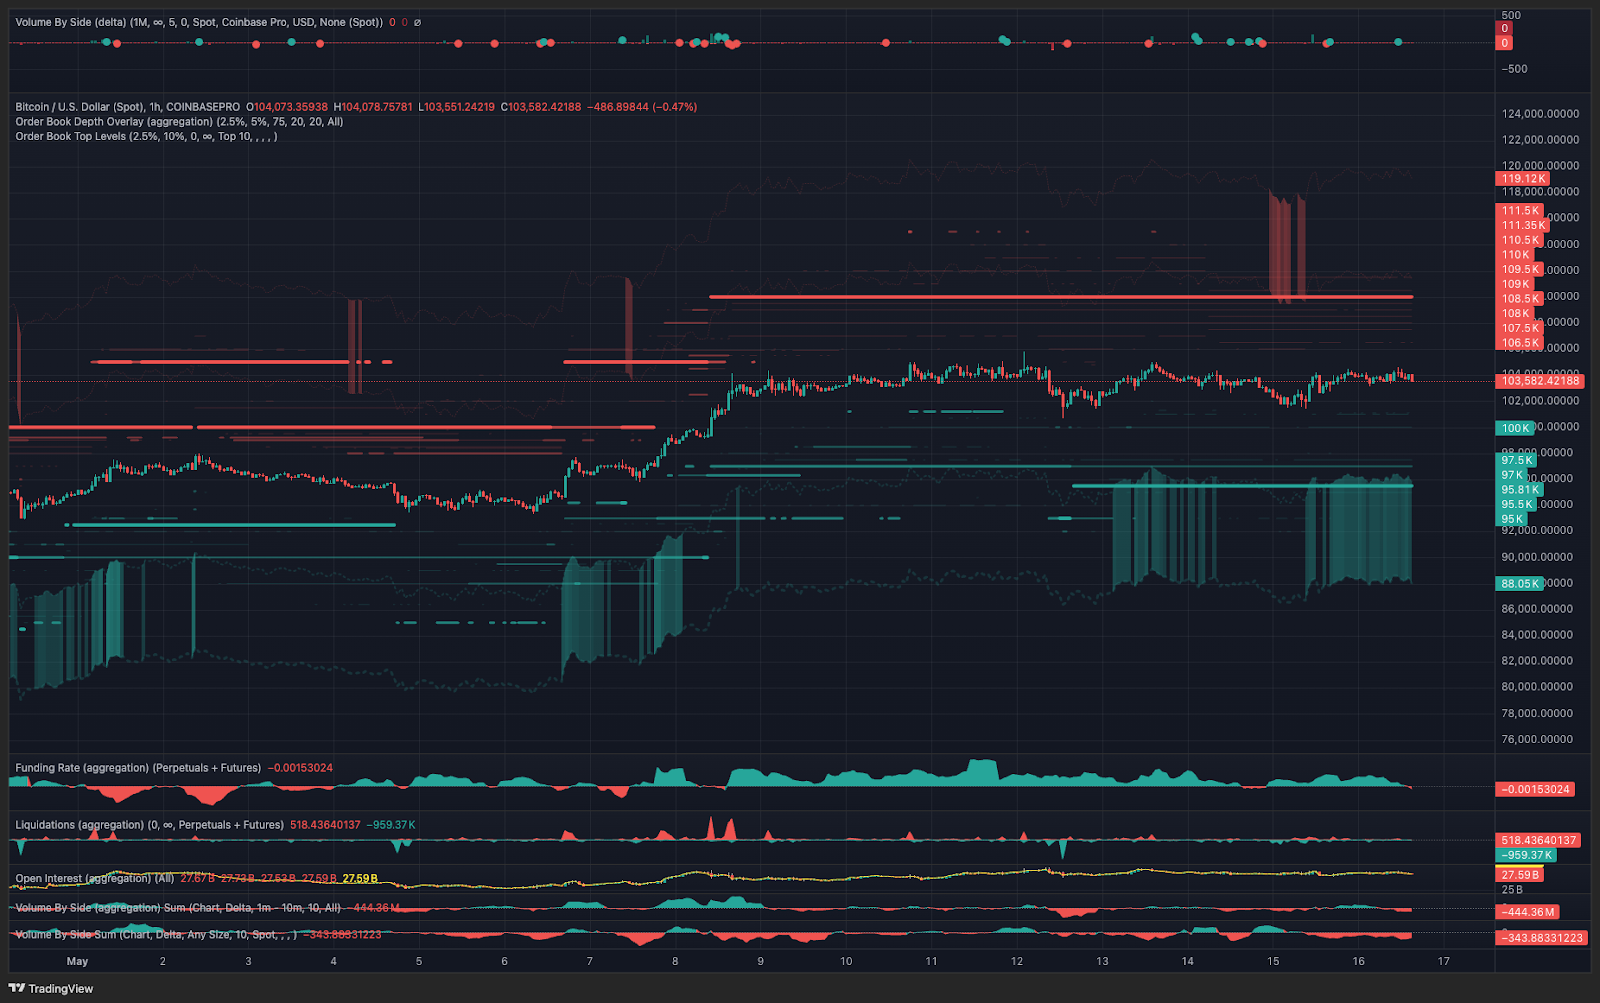
Analysts are divided on the short-term outlook. Some believe that Bitcoin could test support levels between $100,000 and $90,000 before resuming its upward trajectory, while others remain cautiously optimistic, predicting a continuation of the bull run.
Key Takeaways:
- Bitcoin’s current price consolidation could be a bull flag pattern, indicating a potential continuation of the uptrend.
- On-chain data suggests that profit taking is a normal occurrence after a significant price rally and doesn’t signal an end to Bitcoin’s bullish momentum.
- The short-term outlook for Bitcoin is uncertain, with some analysts predicting a test of support levels while others remain cautiously bullish.
Disclaimer:
This article is intended for informational purposes only and does not constitute financial advice. Every investment and trading decision involves risk, and readers should conduct their own research before making any decisions.