

Ethereum‘s Bullish Charge: Transaction Fees Hit 3-Month High, Fueling $4,000 Target
Ethereum‘s price has been on a tear recently, surging nearly 56% to an eight-week high of $2,734 on May 23. This strong price performance is fueled by a confluence of bullish factors, including rising transaction fees, increased network activity, and a positive technical setup that points towards a potential breakout towards $4,000.
High Transaction Fees Indicate Growing Network Activity
Ethereum‘s daily transaction count has climbed by 37% over the past 30 days, reaching levels last seen in January 2024, when the hype around US-based spot Bitcoin ETFs pushed ETH prices above $4,000 for the first time since December 2021. This surge in activity suggests strong user engagement and demand for Ethereum‘s network, a positive sign for the cryptocurrency’s long-term prospects.
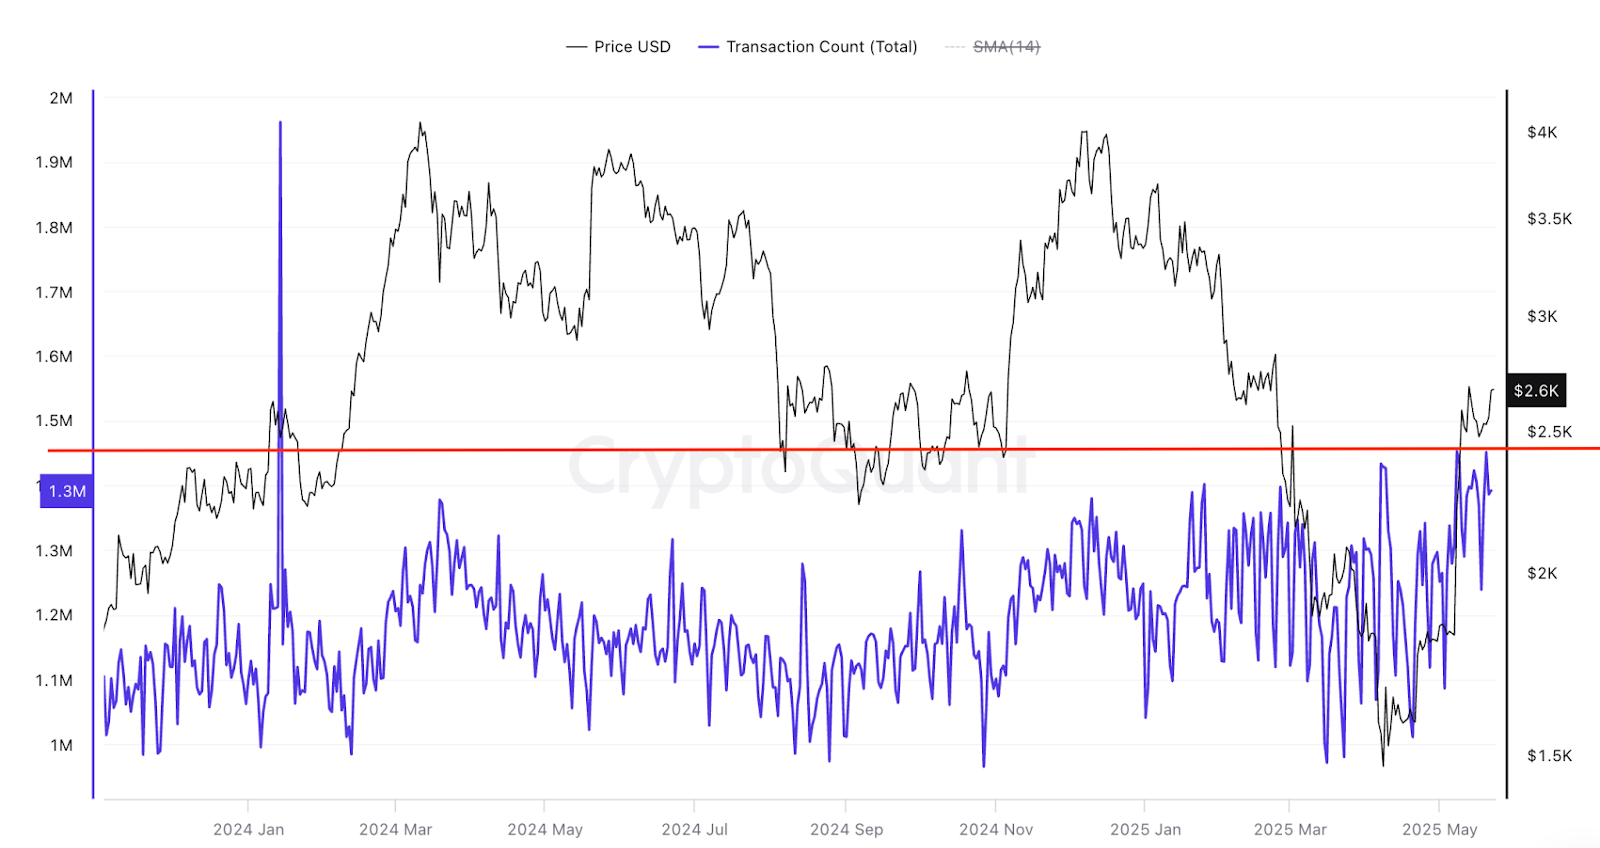
Moreover, Ethereum‘s daily average transaction fees have skyrocketed, hitting a 90-day high of 0.0005 ETH ($1.33) on May 22. These high fees are often associated with high network utilization and bullish sentiment, as more users are interacting with the Ethereum network for various purposes, including DeFi, NFTs, and other decentralized applications (DApps).

Growing Total Value Locked (TVL) Reinforces Confidence in Ethereum
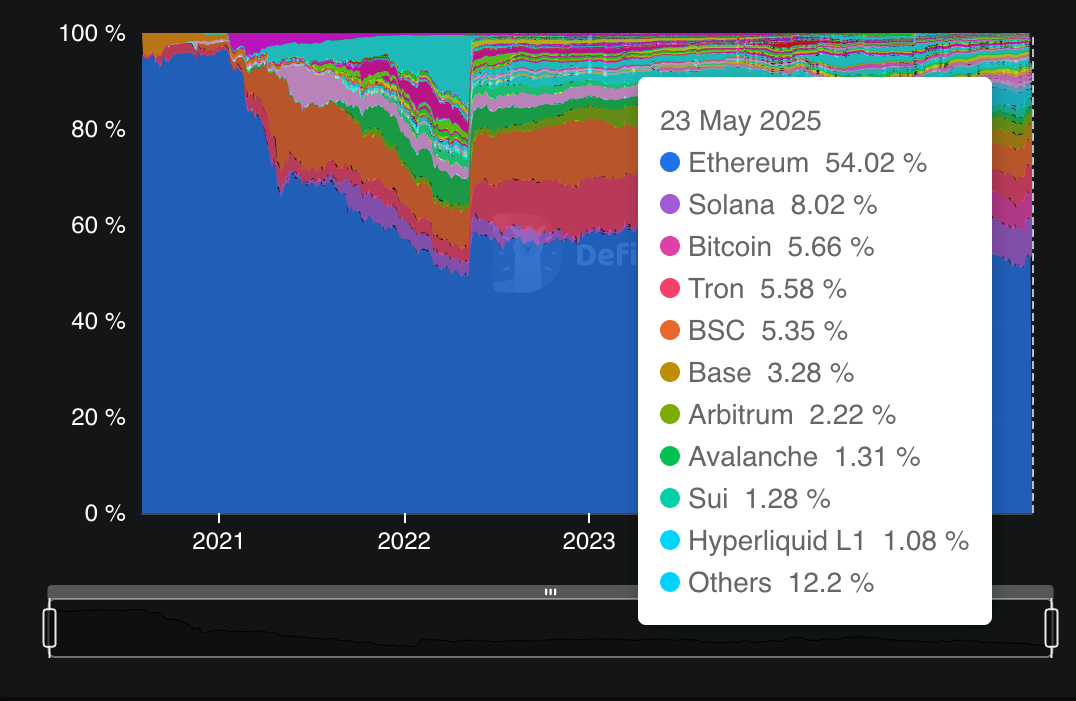
Ethereum‘s total value locked (TVL) on its smart contracts has also seen a significant increase, rising to $65.3 billion on May 23 from $45.26 billion on April 22, representing a surge of over 44% in almost 30 days. This growth in TVL demonstrates that more users are entrusting their assets to Ethereum‘s smart contracts, bolstering confidence in the network’s security and utility.

The increase in deposits on various protocols, including Pendle (51%), Ether.fi (48%), and EingenLayer (48%), further strengthens this bullish narrative. Notably, Ethereum remains the undisputed leader in TVL, holding a market dominance of 54% among Layer-1 chains.
Technical Analysis: Bull Flag Pattern Points to $4,000 Target
On the daily chart, Ethereum‘s price has formed a ‘bull flag‘ pattern, a bullish setup that typically occurs after a sharp price increase followed by a consolidation phase. This pattern suggests that the price could breakout to the upside, potentially reaching the previous uptrend’s height, which puts the target just below $4,000, representing a 56% increase from current levels.
Crypto analyst Michael van de Poppe echoes this sentiment, stating that ETH needs to hold the $2,400 support level to increase the chances of a move toward $3,500 and beyond.
Conclusion: Ethereum‘s Bullish Momentum Could Continue
With a combination of strong technical indicators, surging transaction fees, increased network activity, and a growing TVL, Ethereum‘s price trajectory appears to be heading upwards. The ‘bull flag‘ pattern and growing user engagement paint a positive picture for Ethereum, potentially setting the stage for a continued rally towards the $4,000 mark. However, investors should proceed with caution and conduct thorough research before making any investment decisions.
