

Navigating the Volatile Seas of Cryptocurrency
In the world of cryptocurrency, volatility reigns supreme. Price swings can be dramatic and swift, and for leveraged traders, this can mean the difference between profit and liquidation. This is where understanding Bitcoin liquidation maps comes in. These maps are not just pretty heatmaps; they hold the key to deciphering market sentiment and navigating the treacherous waters of volatile price movements.
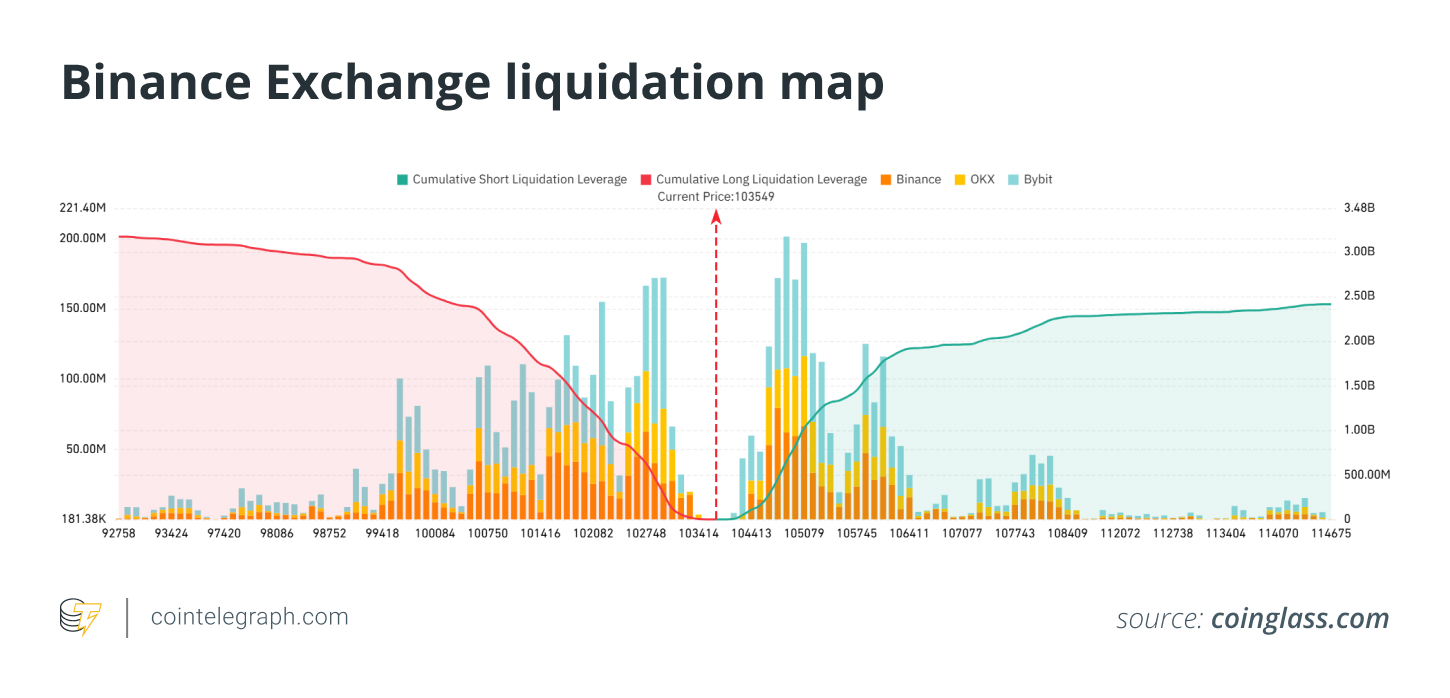
What is a Bitcoin Liquidation Map?
Imagine a visual representation of price levels where a large number of leveraged positions are at risk of being closed forcefully. This is essentially what a Bitcoin liquidation map is. It’s a heatmap that highlights zones where a sudden price shift could trigger a cascade of liquidations, impacting the market in a significant way.
Think of it as a visual guide to market sentiment, revealing where the pressure points are. These pressure points can be both opportunities and threats, depending on how you approach them.
Deconstructing the Liquidation Map: Key Components
- Heat Zones: These areas represent price levels where the highest concentration of leveraged positions exists. If prices reach these zones, a significant number of positions could be liquidated, potentially causing a sharp price swing.
- Liquidity Pools: These are collections of stop-loss and liquidation orders that can create rapid price movements. If a price hits a liquidity pool, it can act as a catalyst for further price action in the same direction.
- Open Interest Levels: This metric indicates the total amount of leveraged positions open in the market. Higher open interest levels usually correspond to greater potential for liquidations.
- Price Imbalances or Gaps: These areas reveal zones where there is a lack of support or resistance, making it easier for prices to move swiftly. Recognizing these areas can help you anticipate potential price breakouts or breakdowns.
Leveraging Liquidation Maps for Smarter Trading
Knowing how to interpret a Bitcoin liquidation map can significantly enhance your trading strategy. Here are some practical applications:
- Identify High-Risk Zones: Avoid overleveraging in areas with dense liquidation clusters. These zones are prone to sudden price reversals, which can catch unwary traders off guard.
- Time Entry and Exit Points: Use liquidation clusters to pinpoint optimal entry and exit points. Entering and exiting trades before a cluster is reached can help you lock in profits before potential price reversals.
- Combine with Technical Indicators: Enhance your analysis by integrating liquidation maps with other technical tools like support/resistance levels, moving averages, and the Relative Strength Index (RSI). This provides a more comprehensive picture of market conditions.
- Avoid Herd Mentality: Exercise caution in areas with high leverage concentrations. These zones can be traps set by larger players to trigger liquidations and profit from the resulting volatility.
- Monitor Whale Activity: Large traders often target liquidation zones to exploit price movements. Observing these patterns can provide valuable insights into potential market direction.
- Anticipate Reversals: Markets often experience reversals after large liquidation events. Recognizing these trends can help you position yourself for potential rebounds.
- Implement Robust Risk Management: Use stop-loss orders and manage leverage carefully. Liquidation maps can help you determine where to place these orders to minimize your exposure to risk.
Caveats and Common Mistakes
While liquidation maps are powerful tools, they are not foolproof. Here are some common mistakes to avoid:
- Blindly Trading Toward Liquidity Zones: Don’t assume that just because prices are moving toward a liquidity zone, they will break through it. Be prepared for potential reversals.
- Misreading Map Colors or Scale: Ensure you understand the color scheme and scale of the map. Misinterpreting these elements can lead to inaccurate risk assessments.
- Over-Relying on Liquidation Data Without Context: Liquidation maps provide valuable insights, but they shouldn’t be the only factor guiding your trading decisions. Consider other market indicators and fundamental analysis as well.
- Ignoring Macro News or Sentiment Analysis: External events can significantly influence market dynamics, sometimes overriding technical signals. Stay informed about broader economic trends and market sentiment.
Ultimately, the key to success in using Bitcoin liquidation maps lies in combining them with other technical analysis techniques and a sound understanding of market fundamentals. Remember, the cryptocurrency market is complex, and there are no guarantees. Use these maps to gain a deeper understanding of market dynamics and to make informed trading decisions.
This article does not constitute investment advice or recommendations. Every investment and trading move involves risk, and readers should conduct their own research when making a decision.