

XRP‘s Recent Rally Faces Uncertain Future
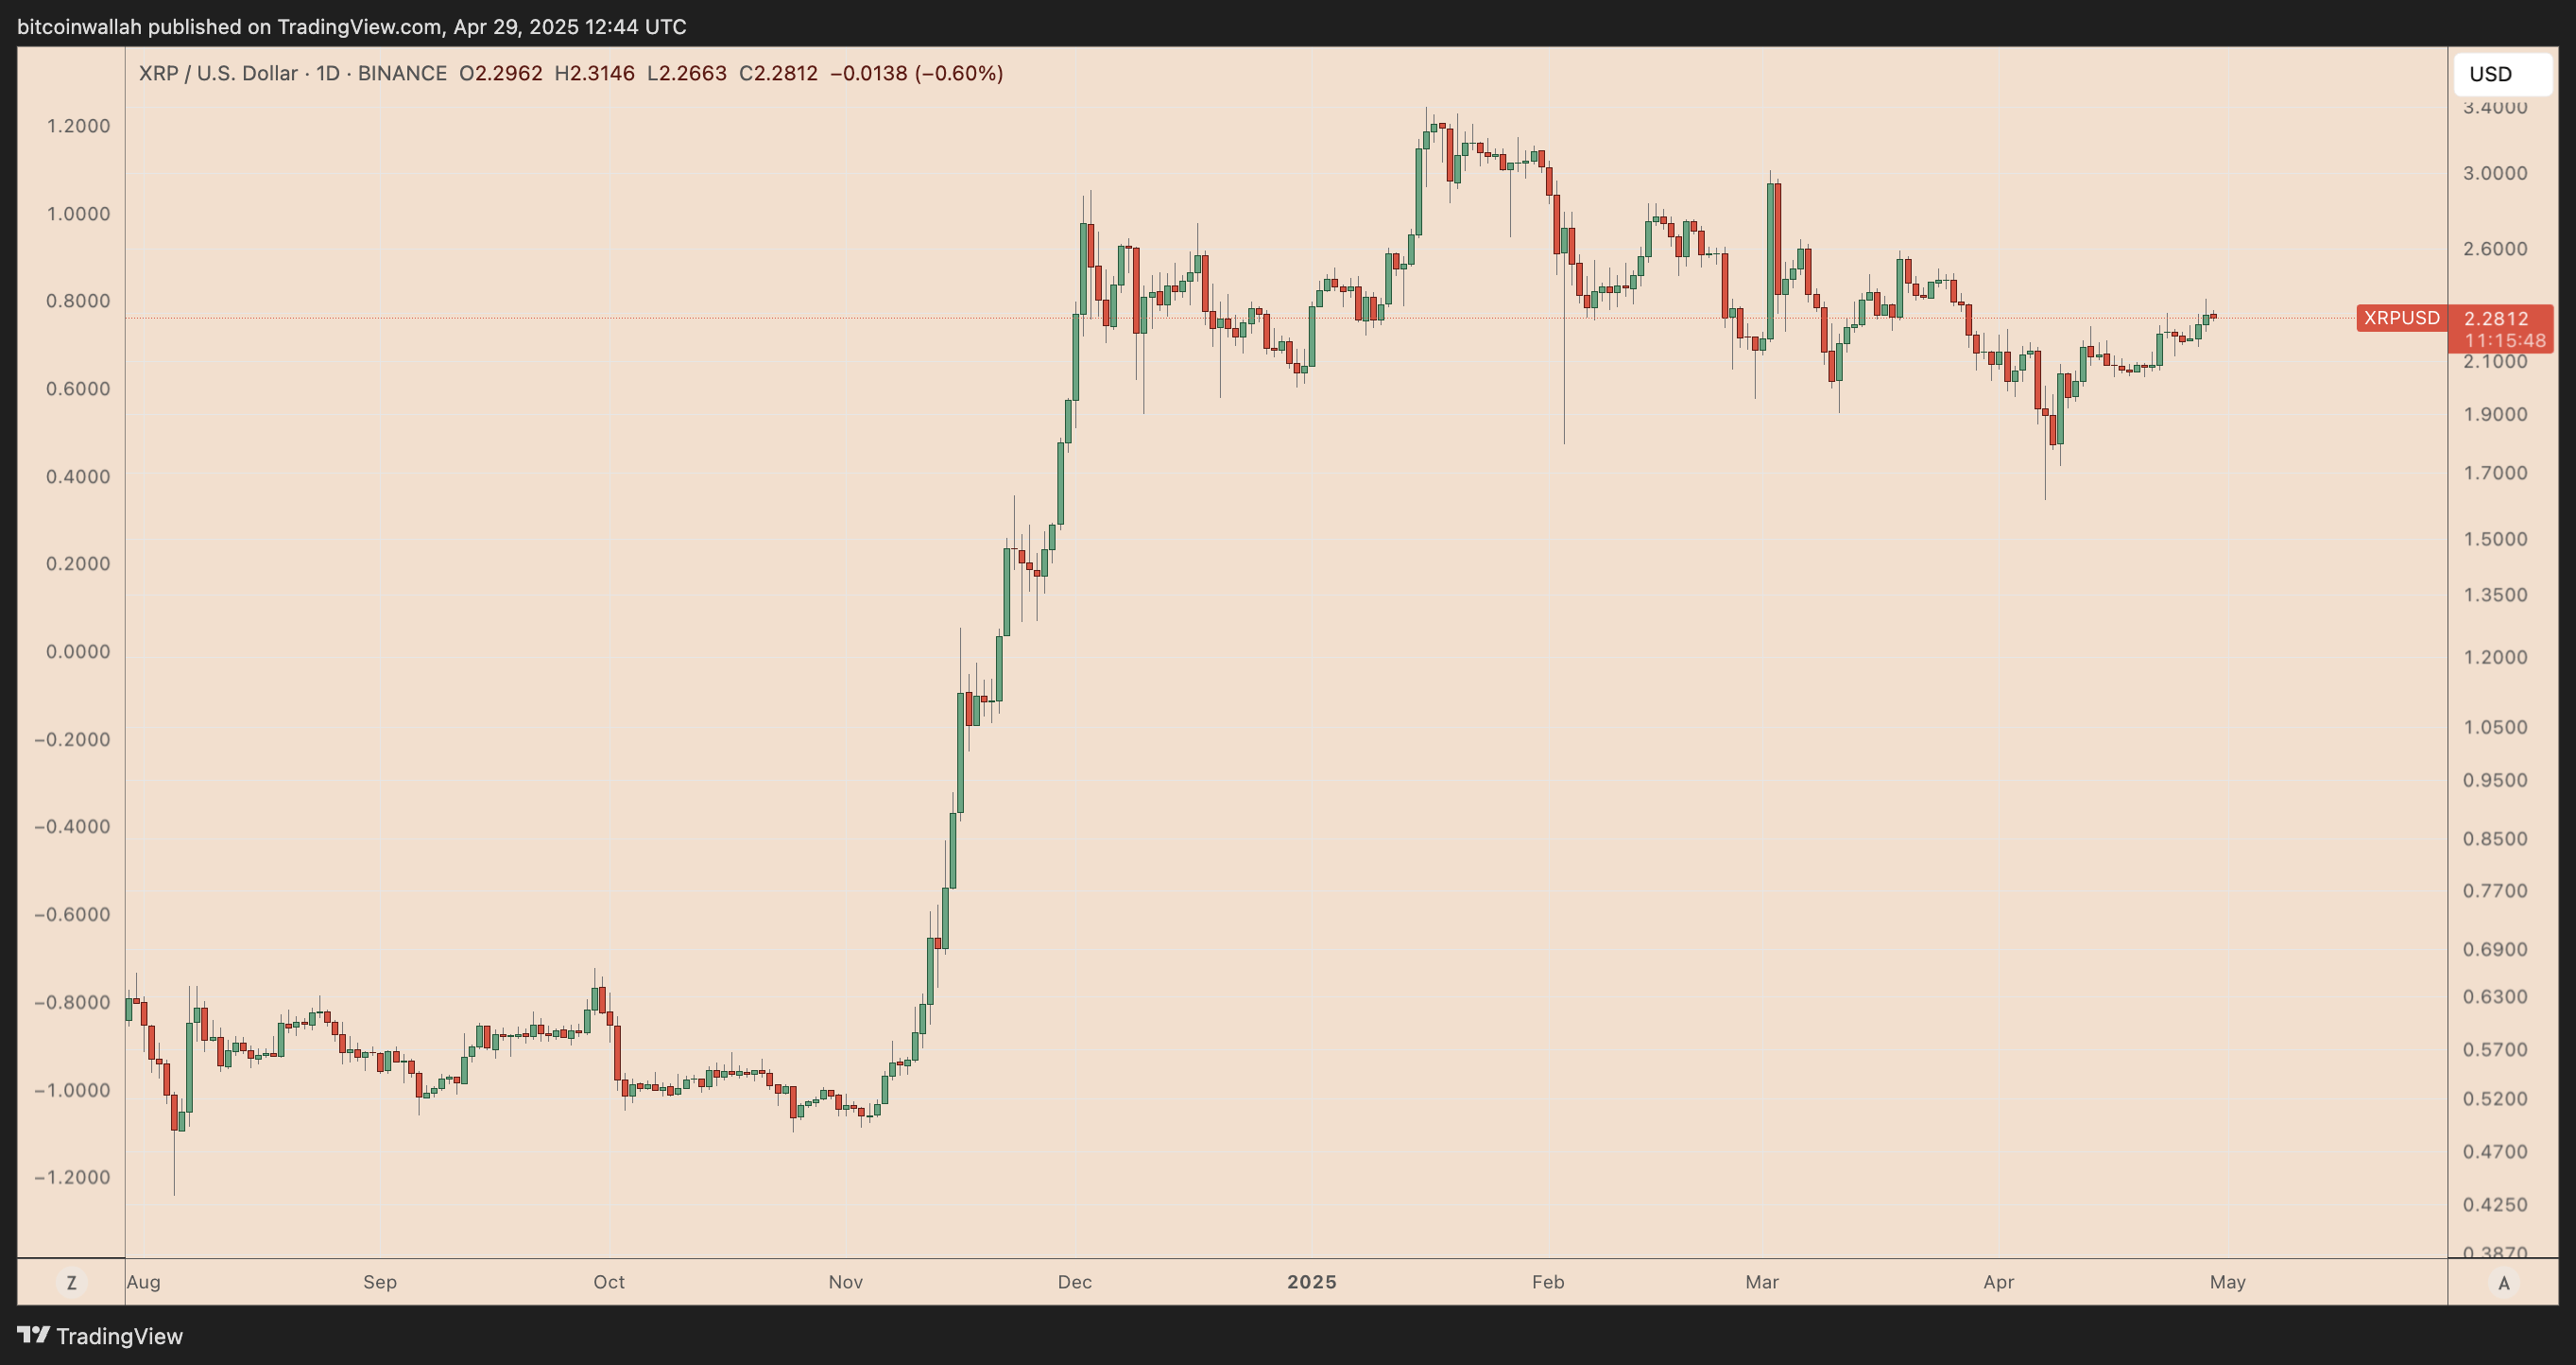
XRP (XRP) has witnessed a remarkable rebound, soaring over 40% in the last three weeks to surpass $2.28 on April 29. However, despite this resurgence, the crypto asset remains over 30% below its recent high of $3.39. The question now is: will this recovery sustain, or will XRP face further price declines?
Rising Wedge Pattern Raises Sell-Off Concerns
A rising wedge pattern on the 4-hour chart raises concerns about a potential short-term correction. This pattern, characterized by converging upward-sloping trendlines, suggests weakening bullish momentum and a possible trend reversal. A breakdown below the wedge’s lower support could send XRP toward $1.89, representing a 17% decline from current levels, by mid-May.
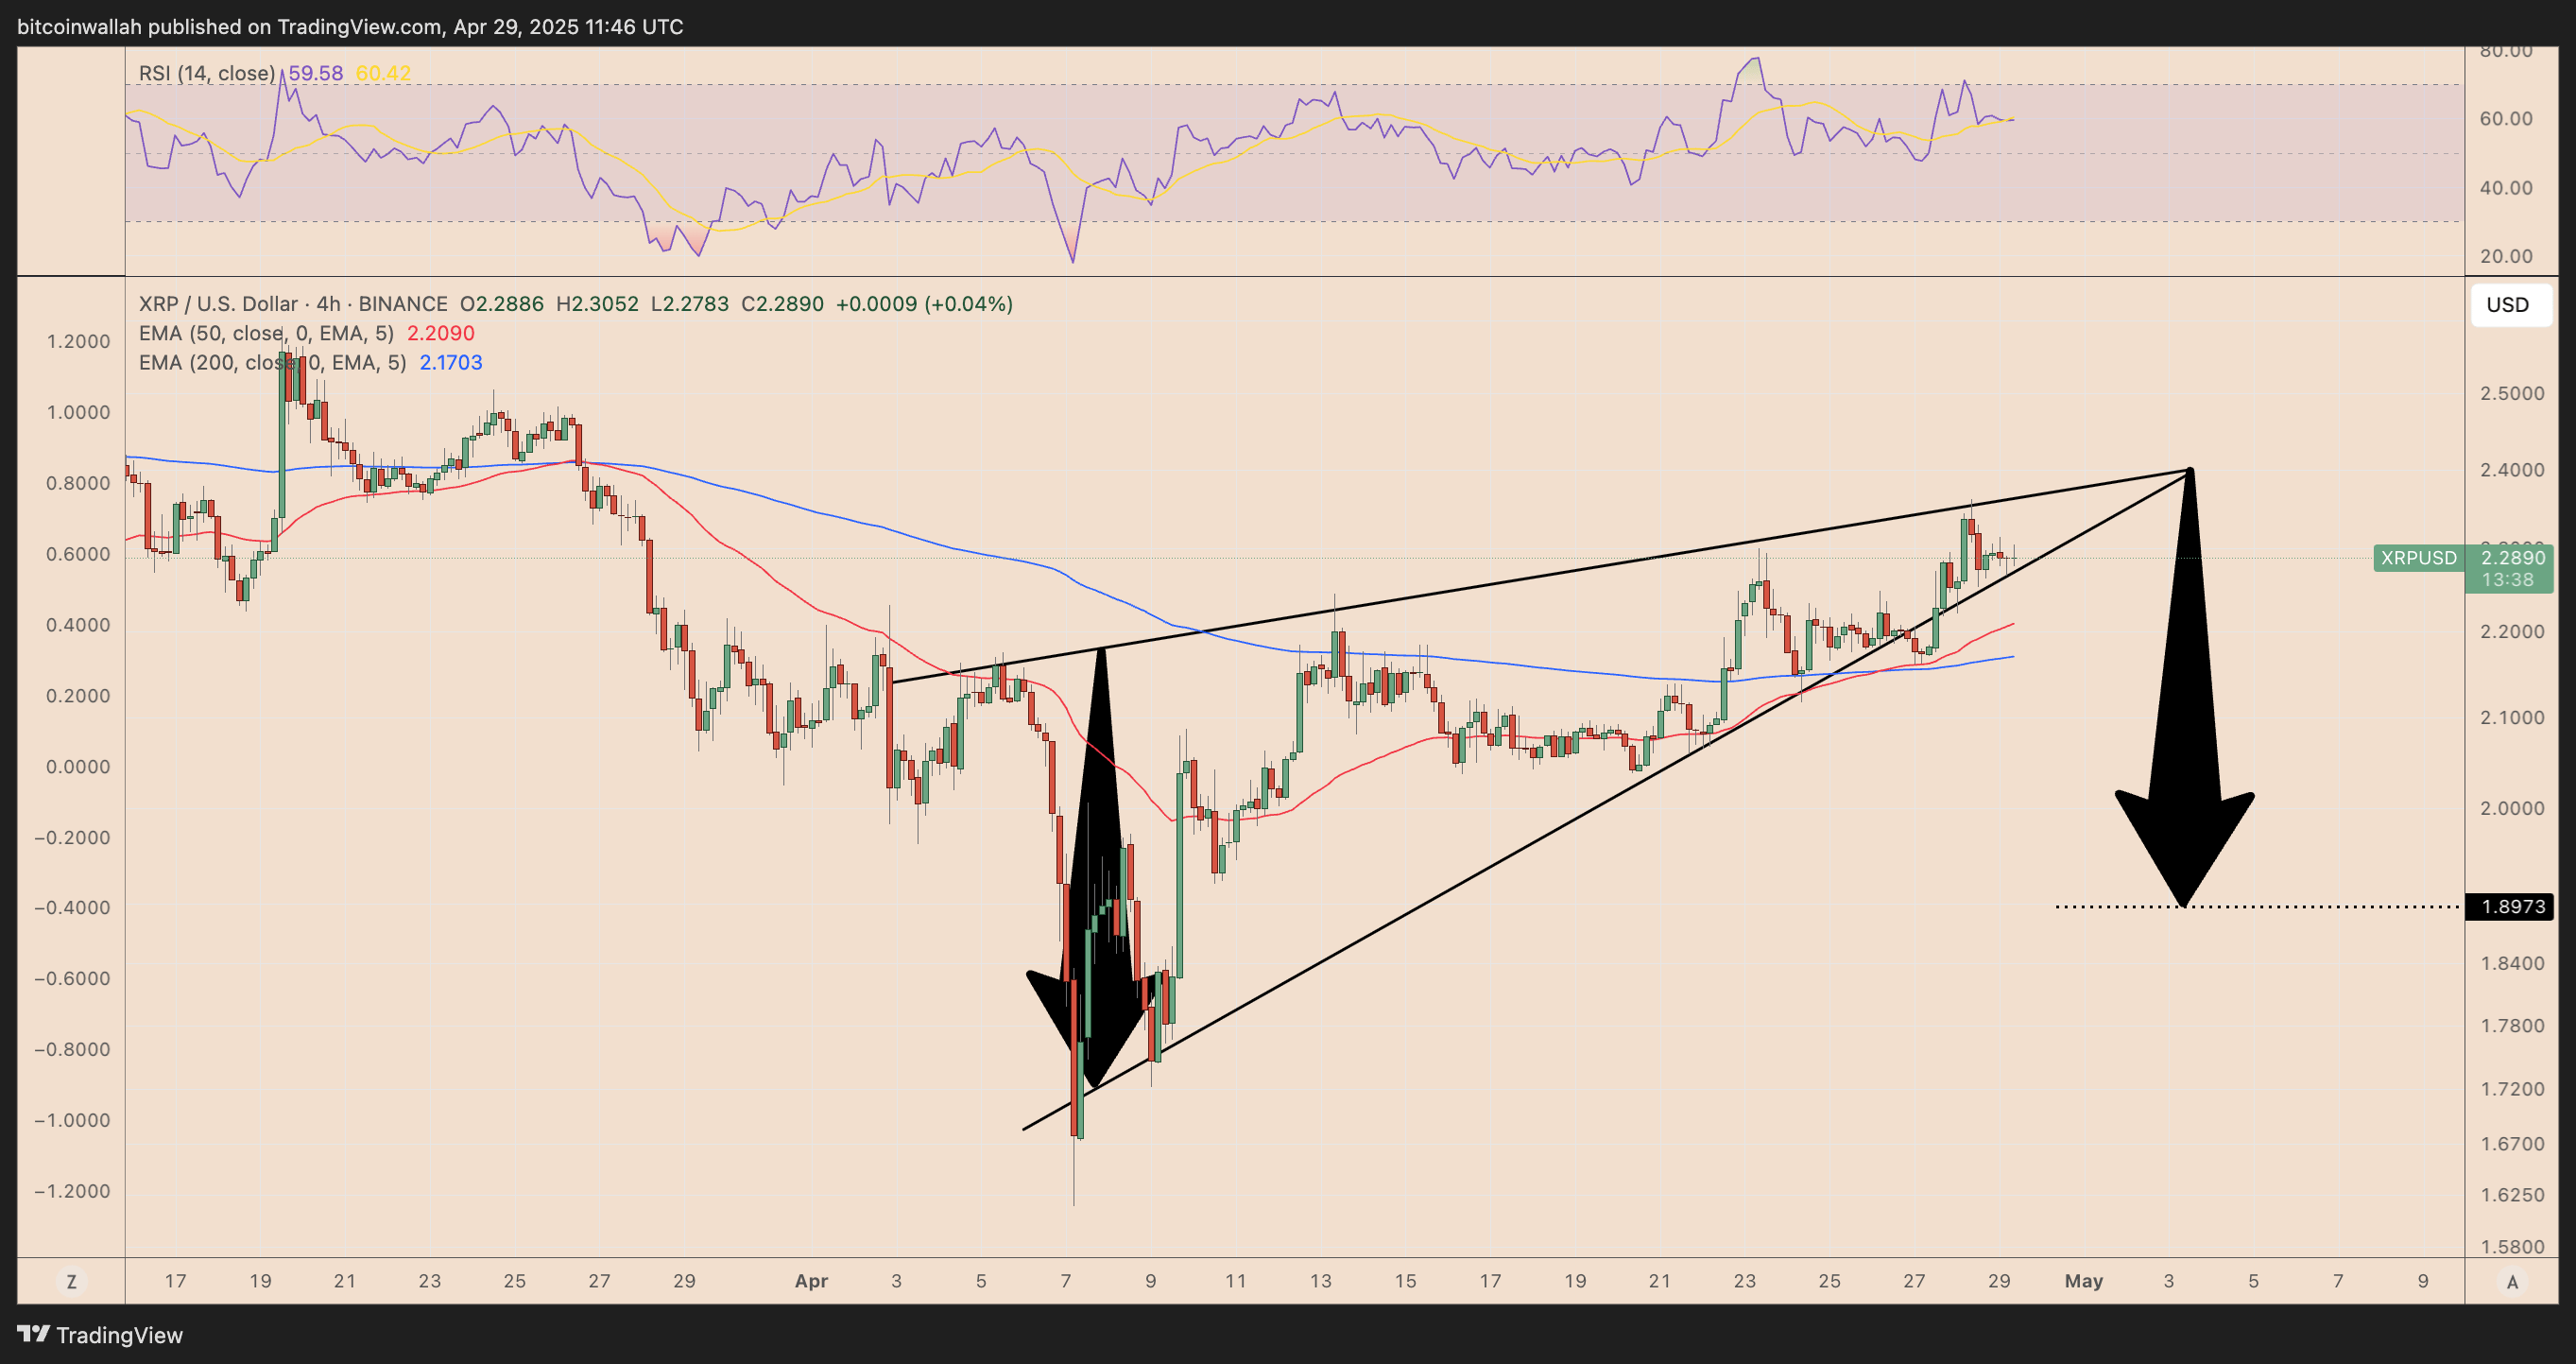
Further fueling this bearish outlook is the XRP relative strength index (RSI), which is hovering near 60. This indicates an approach to overbought territory, potentially triggering profit-taking by traders.
XRP’s Elevated Realized Price Sparks Caution
XRP’s current realized price, a measure of the average acquisition cost of all circulating tokens, sits at $1.02. This indicates a significant divergence from the current spot price, with XRP trading over 120% above its realized price. Such a large gap historically suggests speculative euphoria and increased risk.
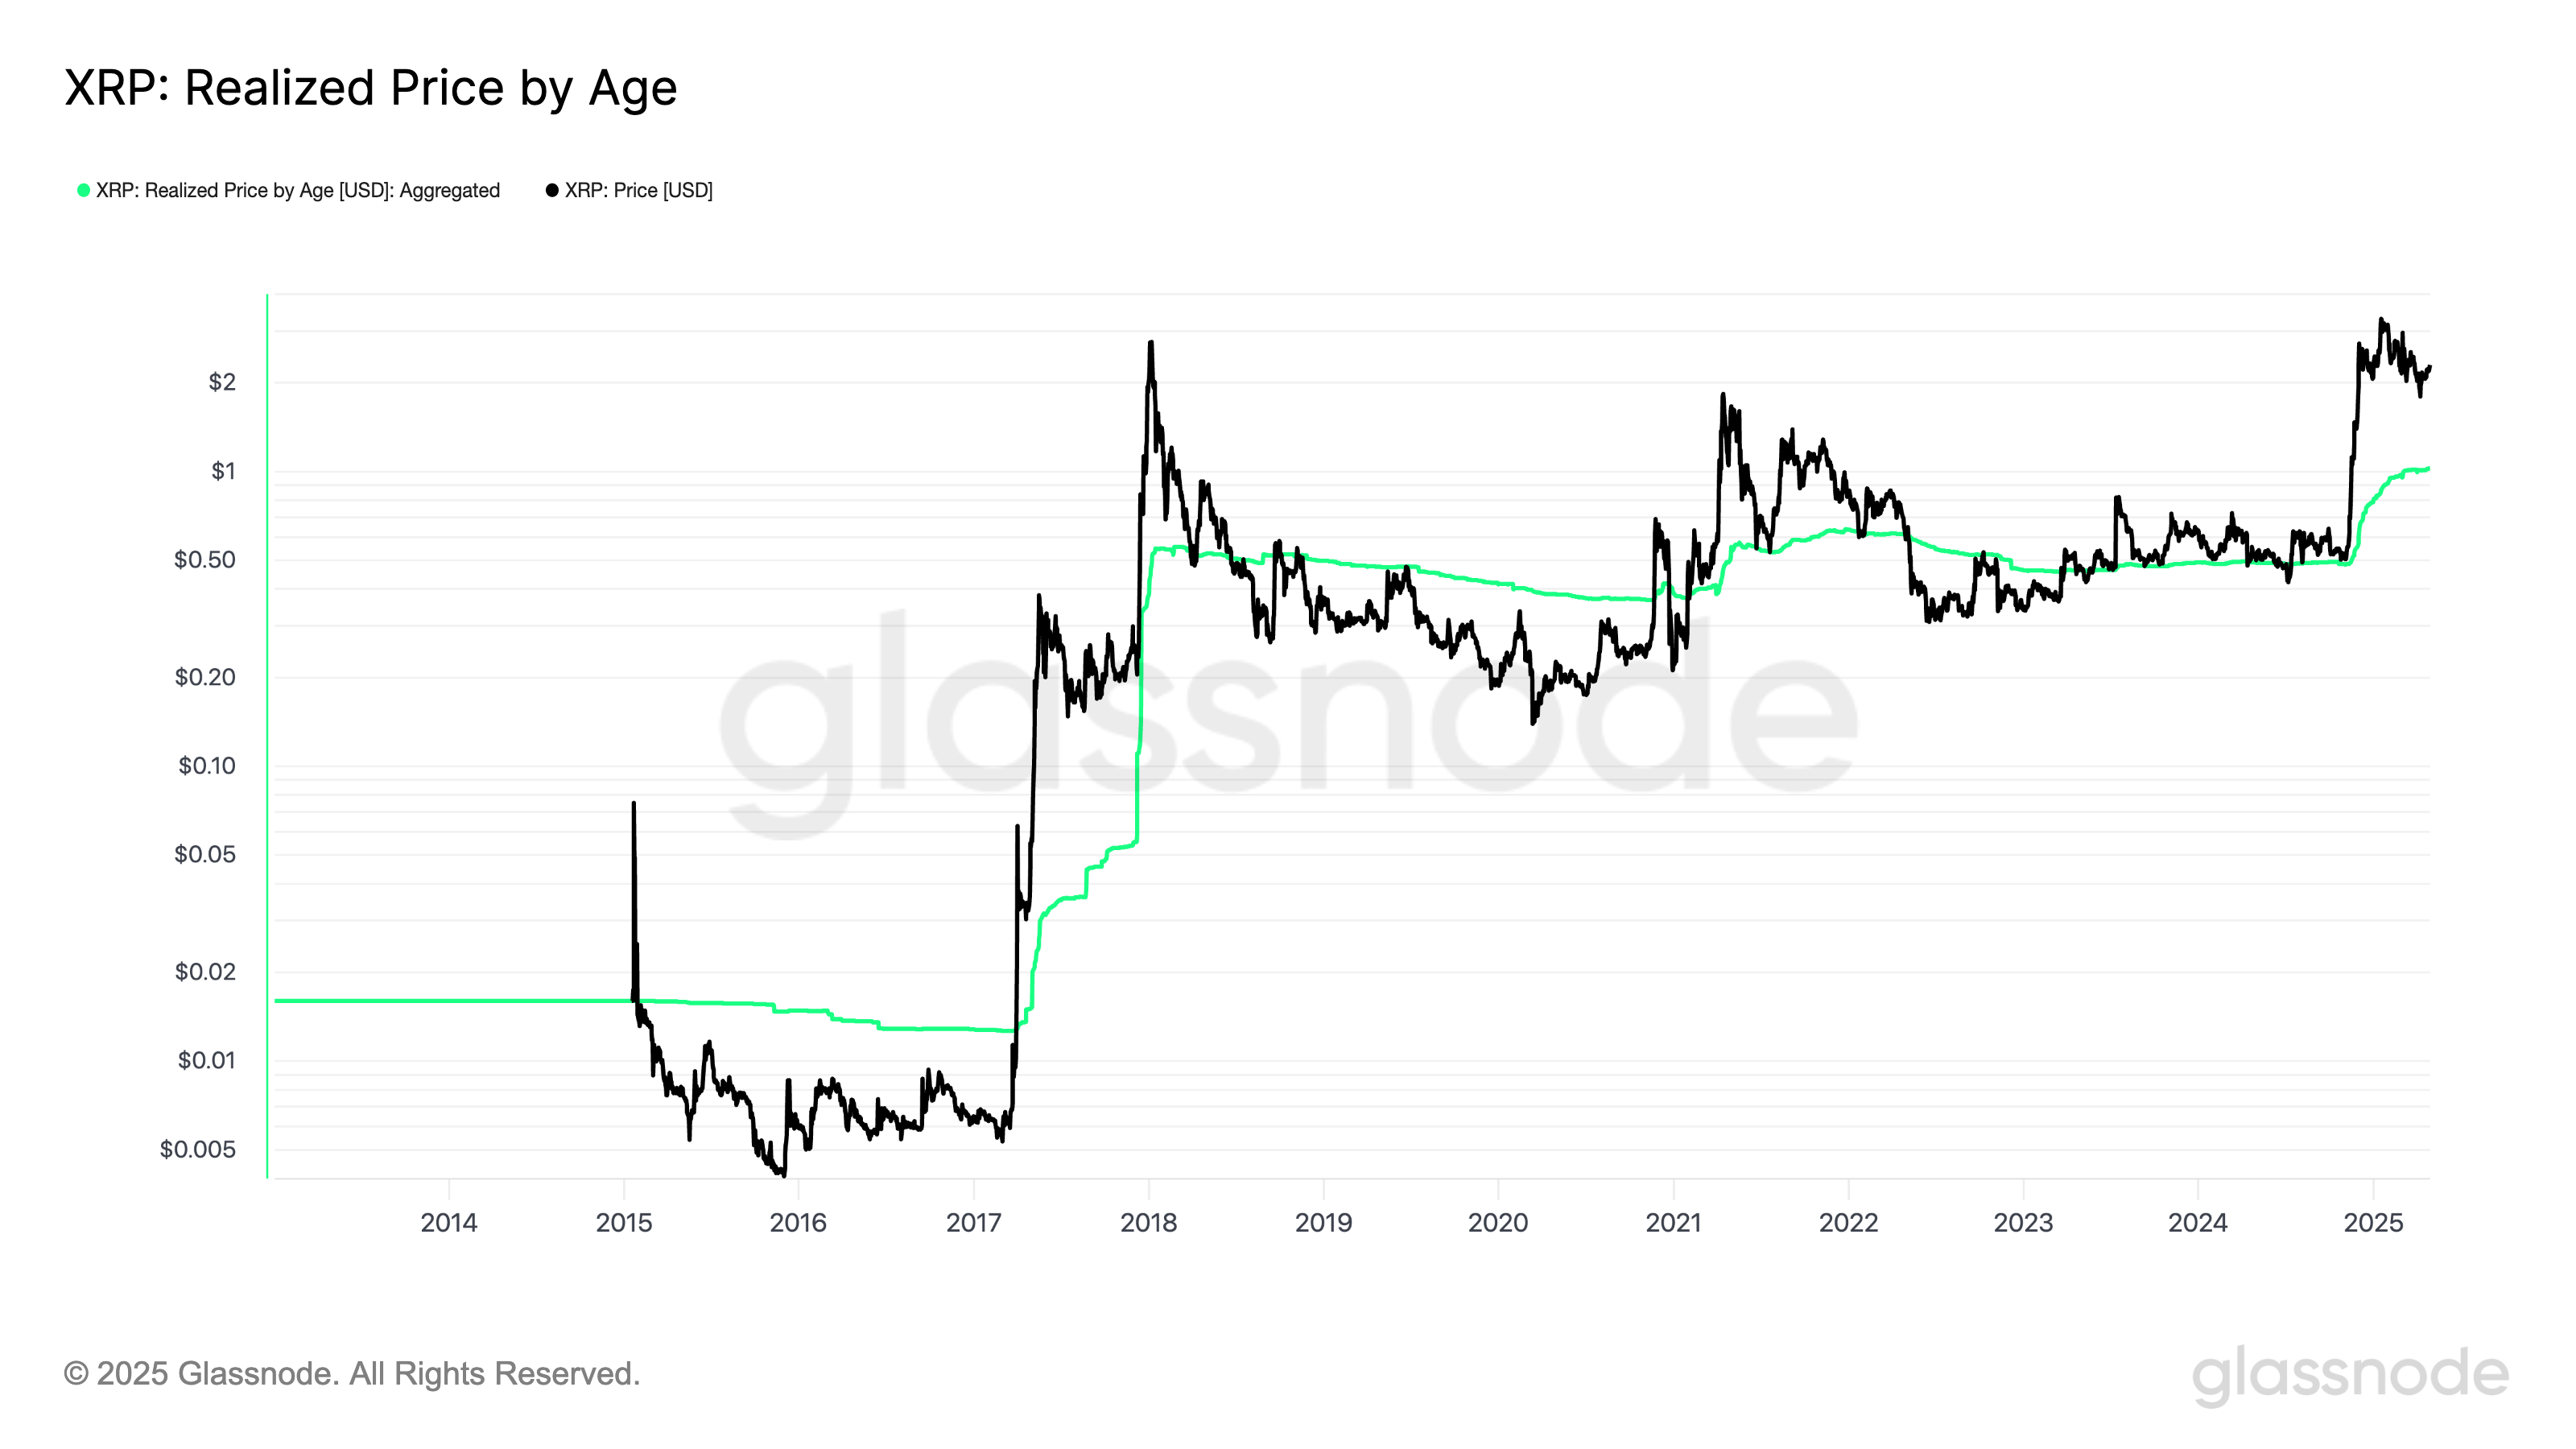
In early 2018 and mid-2021, similar divergences between XRP’s spot and realized price preceded sharp corrections back towards the realized price level. If bullish momentum weakens, XRP might face heightened selling pressure, potentially leading to a retracement toward the realized price level near $1.02, representing a 50% drop from current prices.
Falling Wedge Offers Hope for Bulls
However, a glimmer of hope emerges from the weekly chart, which displays a classic falling wedge pattern. This formation is often associated with bullish reversal breakouts, indicating declining selling pressure. As prices tighten within the wedge, the potential for a breakout above the upper trendline strengthens.
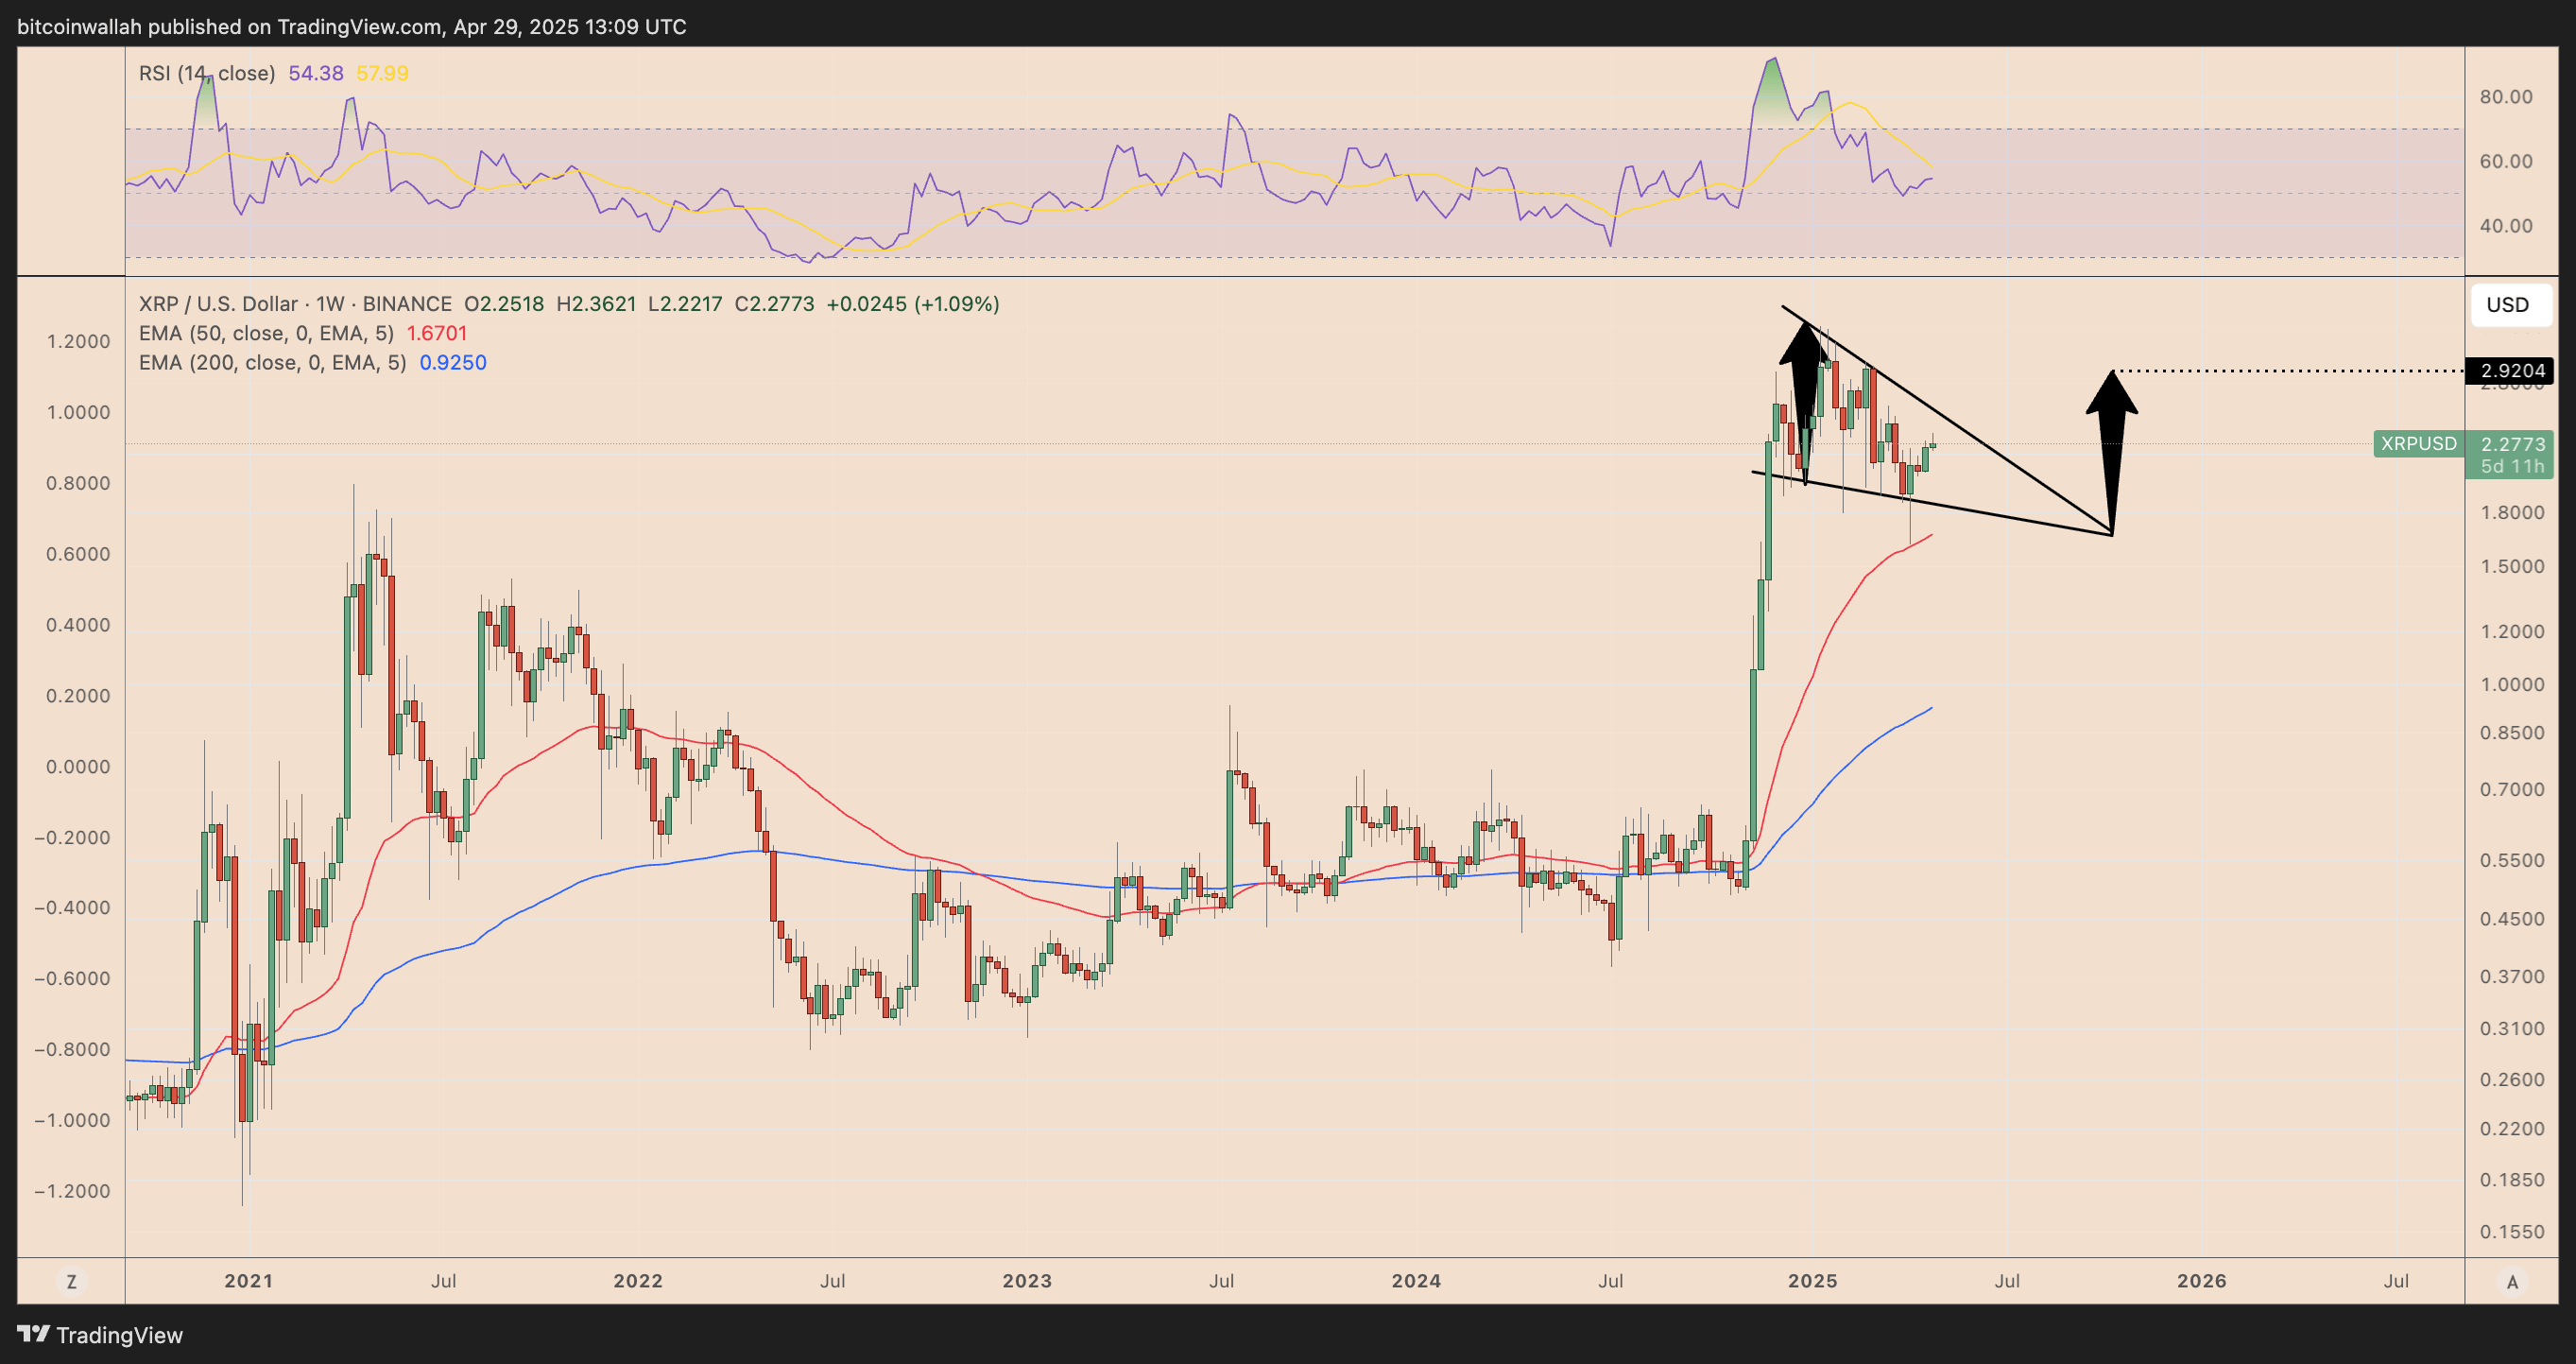
A successful breakout could push XRP toward $2.92 by June, marking a 25% rally from current levels. This bullish outlook is further supported by the RSI rebounding from the midline, signifying a possible return of buying momentum.
Navigating Conflicting Signals
The conflicting signals from these technical indicators highlight the uncertainty surrounding XRP’s price trajectory. While the rising wedge suggests a potential correction, the falling wedge offers a glimpse of bullish continuation. The market’s response to these patterns will ultimately determine XRP’s fate in the coming weeks and months.
It is crucial to remember that this analysis is solely based on technical indicators and does not constitute investment advice. Any trading or investment decisions should be made after careful consideration of your own risk tolerance and thorough research.