Bitcoin‘s Price Action: A Deeper Dive
The digital asset landscape is currently experiencing a crucial juncture. Recent market corrections have prompted a significant shift in investor behavior, as evidenced by the formation of robust buying interest around the $105,000 level for Bitcoin (BTC). This price point appears to be acting as a critical support zone, suggesting a potential stabilization of the market following a period of volatility. The data suggests a deleveraging event rather than a widespread panic sell-off, offering a more optimistic outlook for the long-term health of the Bitcoin market.
Strategic Buying and Market Dynamics
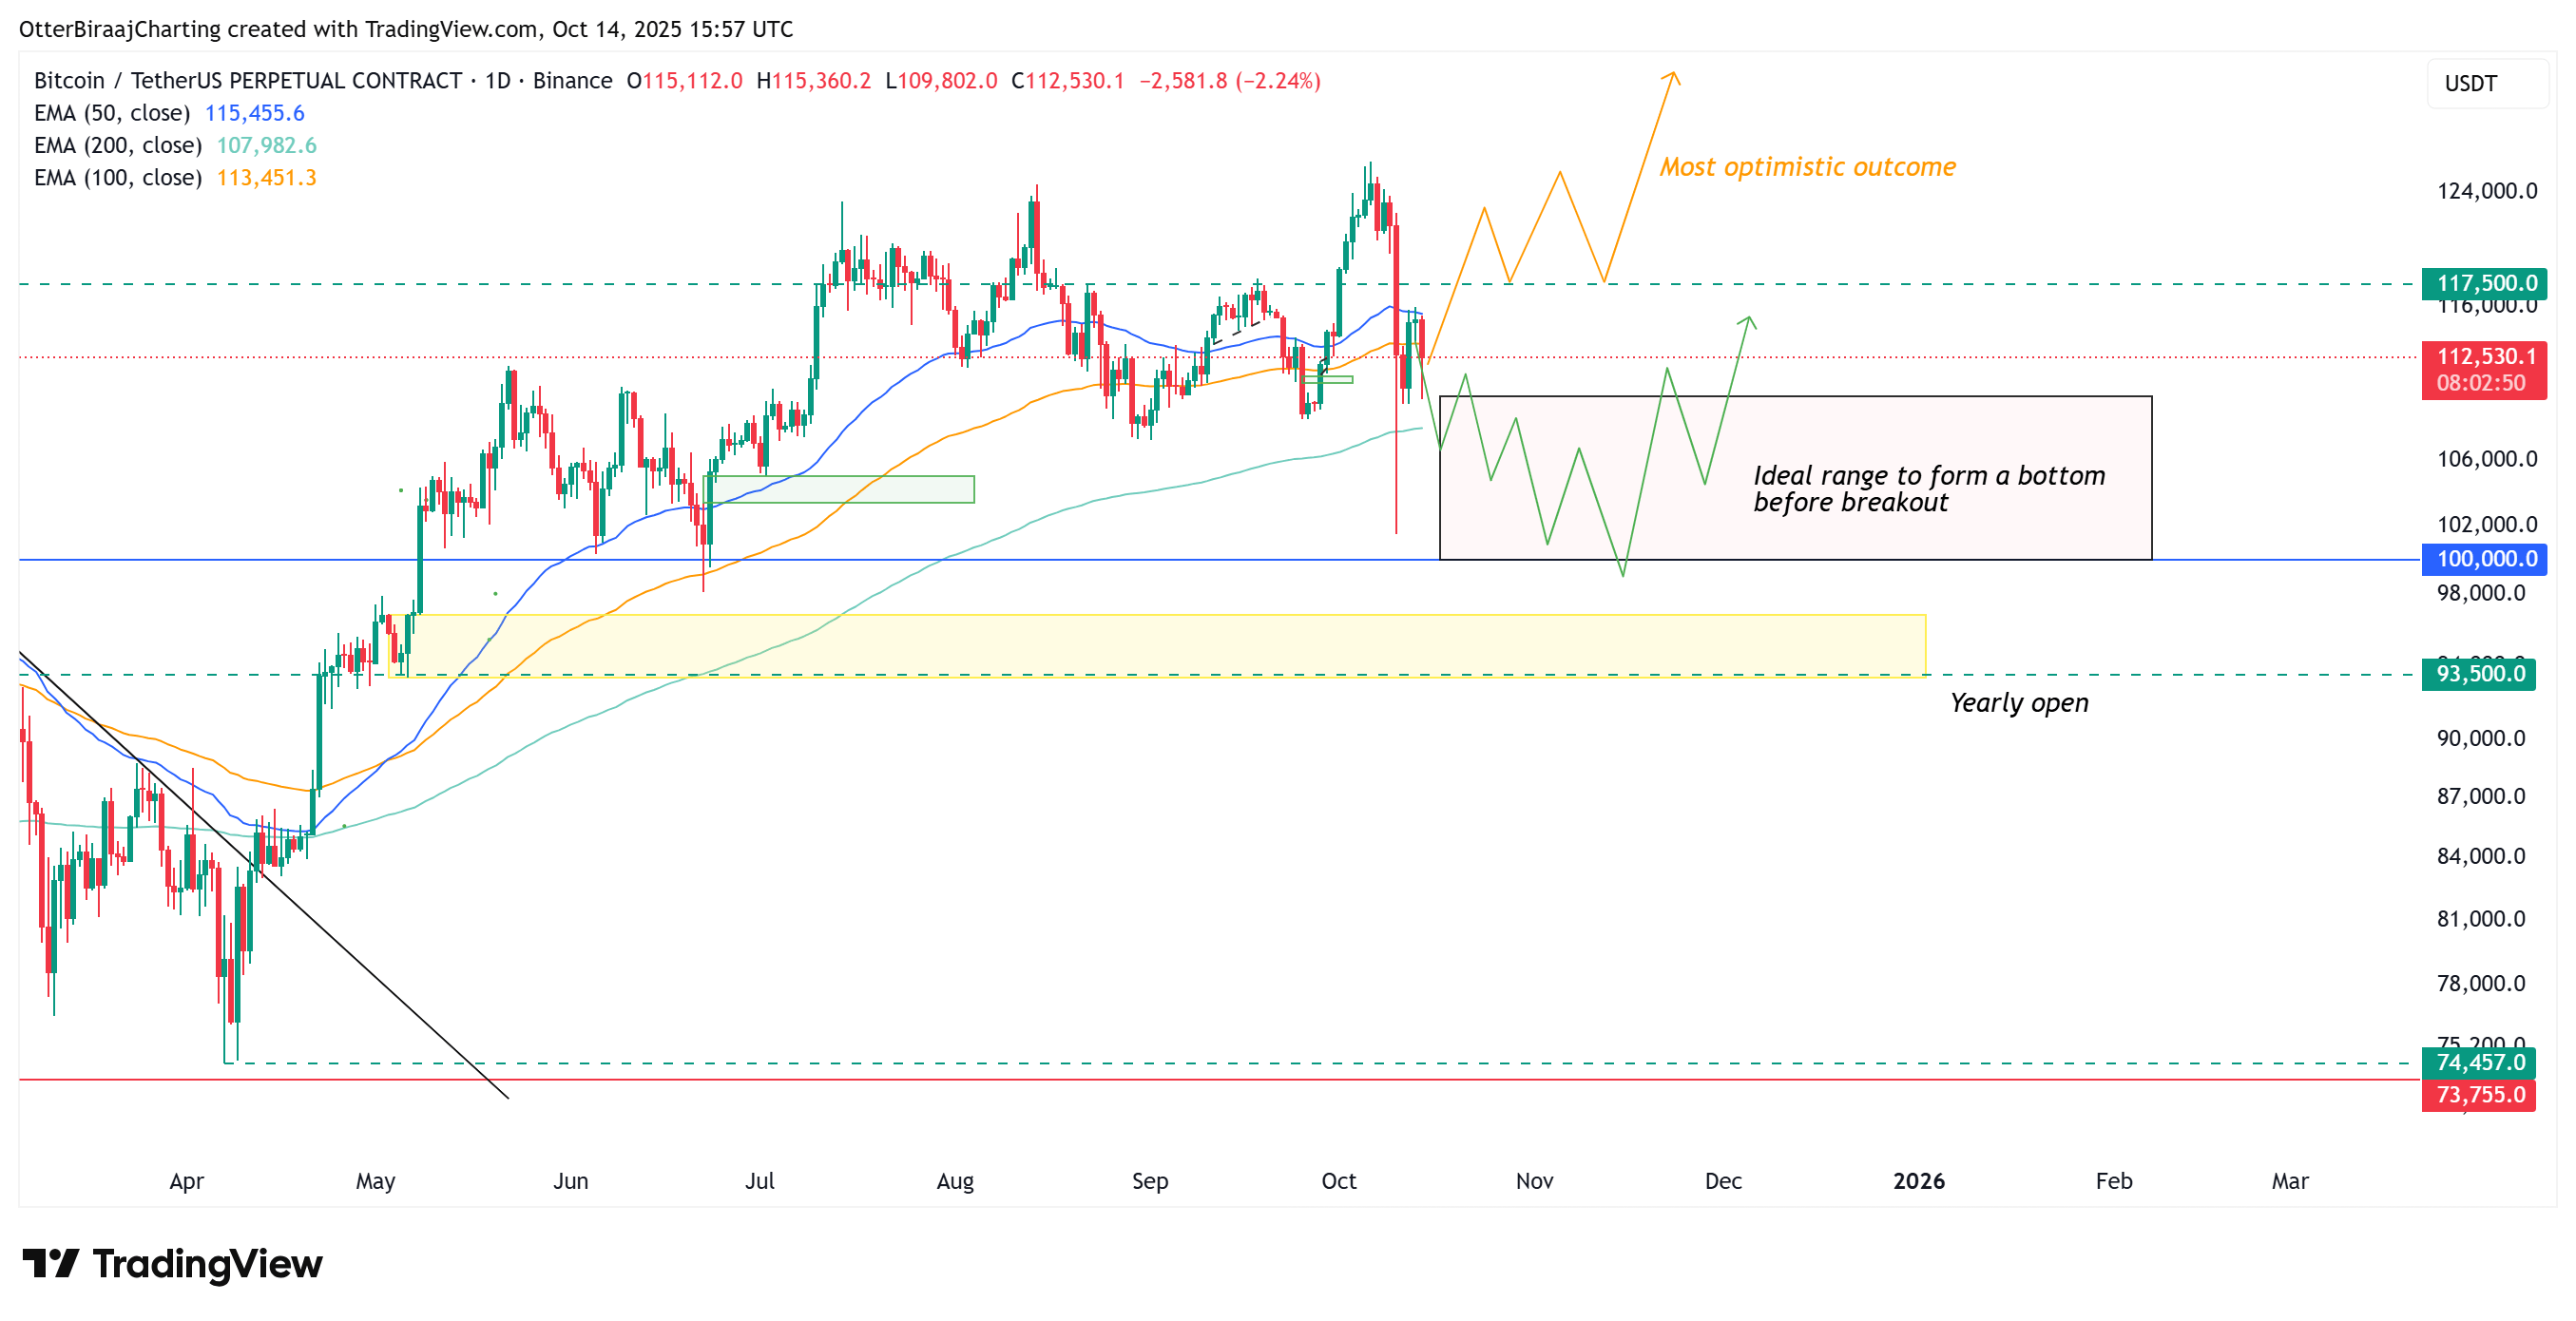
The emergence of substantial bid liquidity between $105,000 and $100,000 is a key indicator of market sentiment. Analysts are keenly observing these levels, as they could dictate the trajectory of Bitcoin’s price. If this support level holds, it may provide a foundation for a rebound. However, a break below $105,000 could bring the yearly open price of $93,500 into focus, potentially acting as a longer-term price target. This scenario underlines the importance of monitoring these pivotal price points for any signs of market weakness or strength.
Leverage vs. Panic: A Critical Distinction
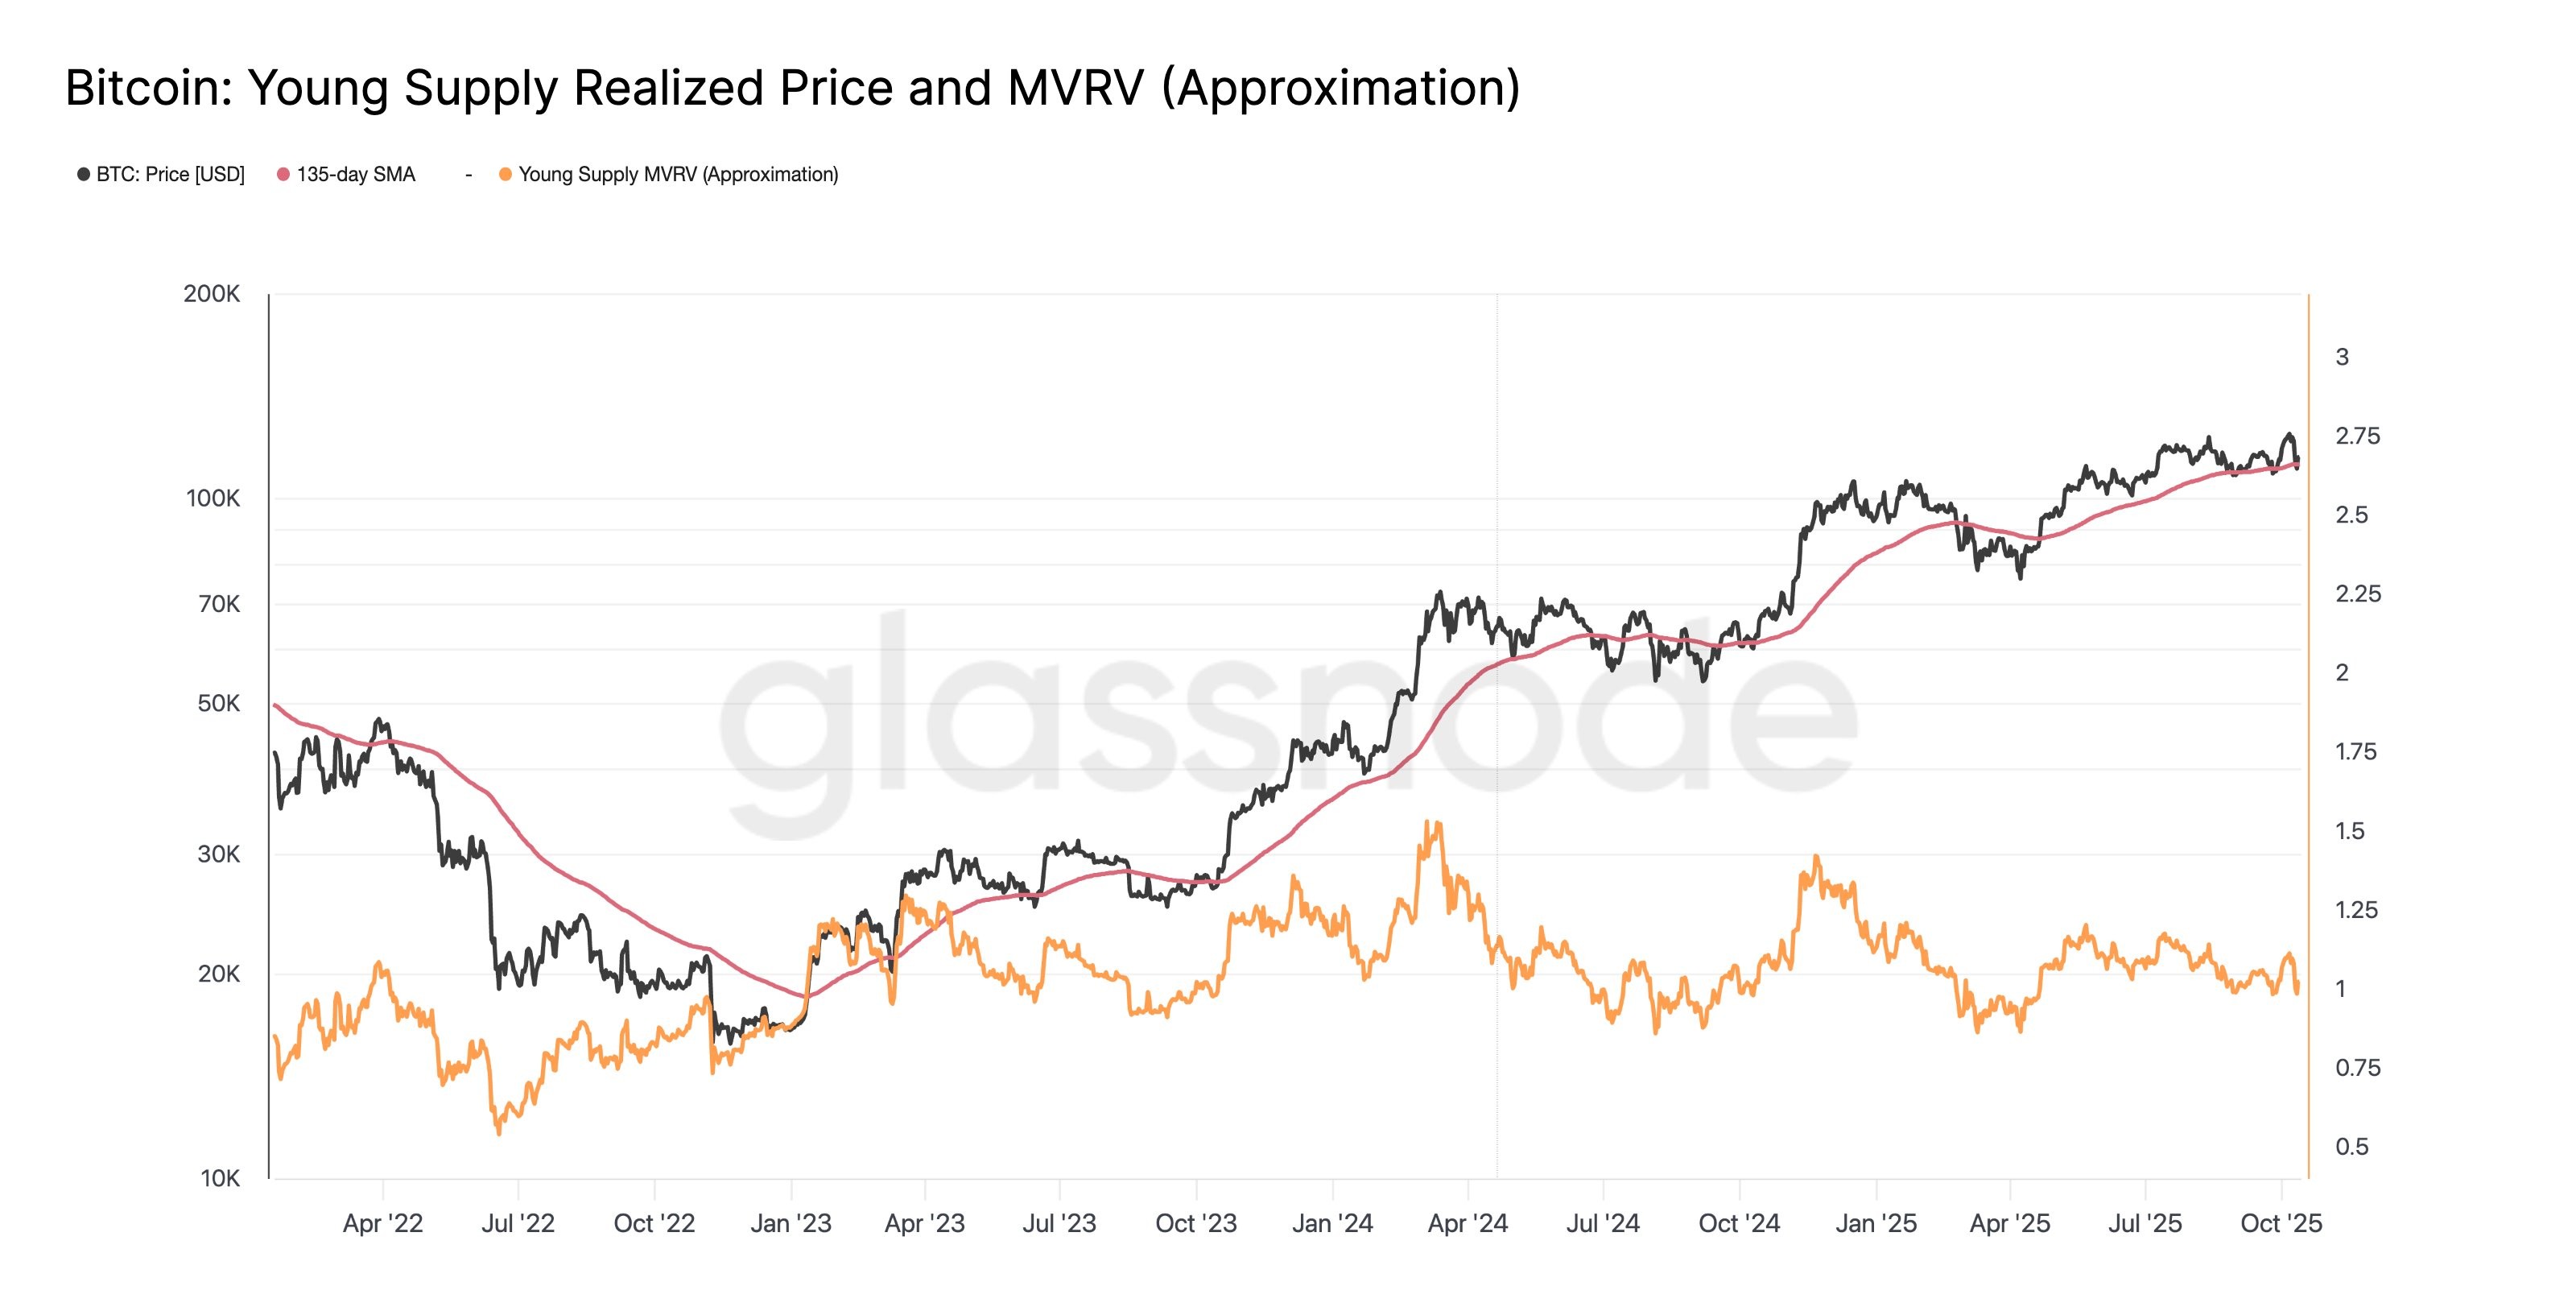
Blockchain analytics firm Glassnode highlights a key difference between the current correction and previous downturns. The fact that over 90% of Bitcoin‘s circulating supply remains profitable implies a leverage-driven correction, rather than a panic-induced sell-off. This distinction is crucial because it suggests that the market’s response is more measured and less likely to trigger a catastrophic cascade of liquidations. This is further supported by the reduction in open interest and relatively low forced liquidations, indicating a controlled reduction of leverage rather than a full-blown collapse.
Key Levels and Potential Scenarios
The $117,500 level is being closely watched as a potential resistance point for a bullish breakout. If Bitcoin can maintain a strong position above this level, it could signal a renewed rally within the coming weeks. Conversely, the market may consolidate within a range of $100,000 to $110,000 as it attempts to establish a solid bottom. The recent low of approximately $101,500 could be revisited, offering a potential buying opportunity before a more definitive bottom forms above $100,000.
Technical Outlook and Long-Term Trend
From a higher time frame perspective, the current price action is testing the multi-year uptrend that has been in place since 2022. This trendline has historically acted as a support level during corrections within the ongoing cycle. If it continues to hold, it will indicate that the broader bull market remains intact, and the recent correction is simply a mid-cycle reset rather than the beginning of a more significant decline. Investors should monitor this key trendline for its potential to influence Bitcoin’s future price trajectory.