

Historic Signal: A Rare Bullish Cross Appears
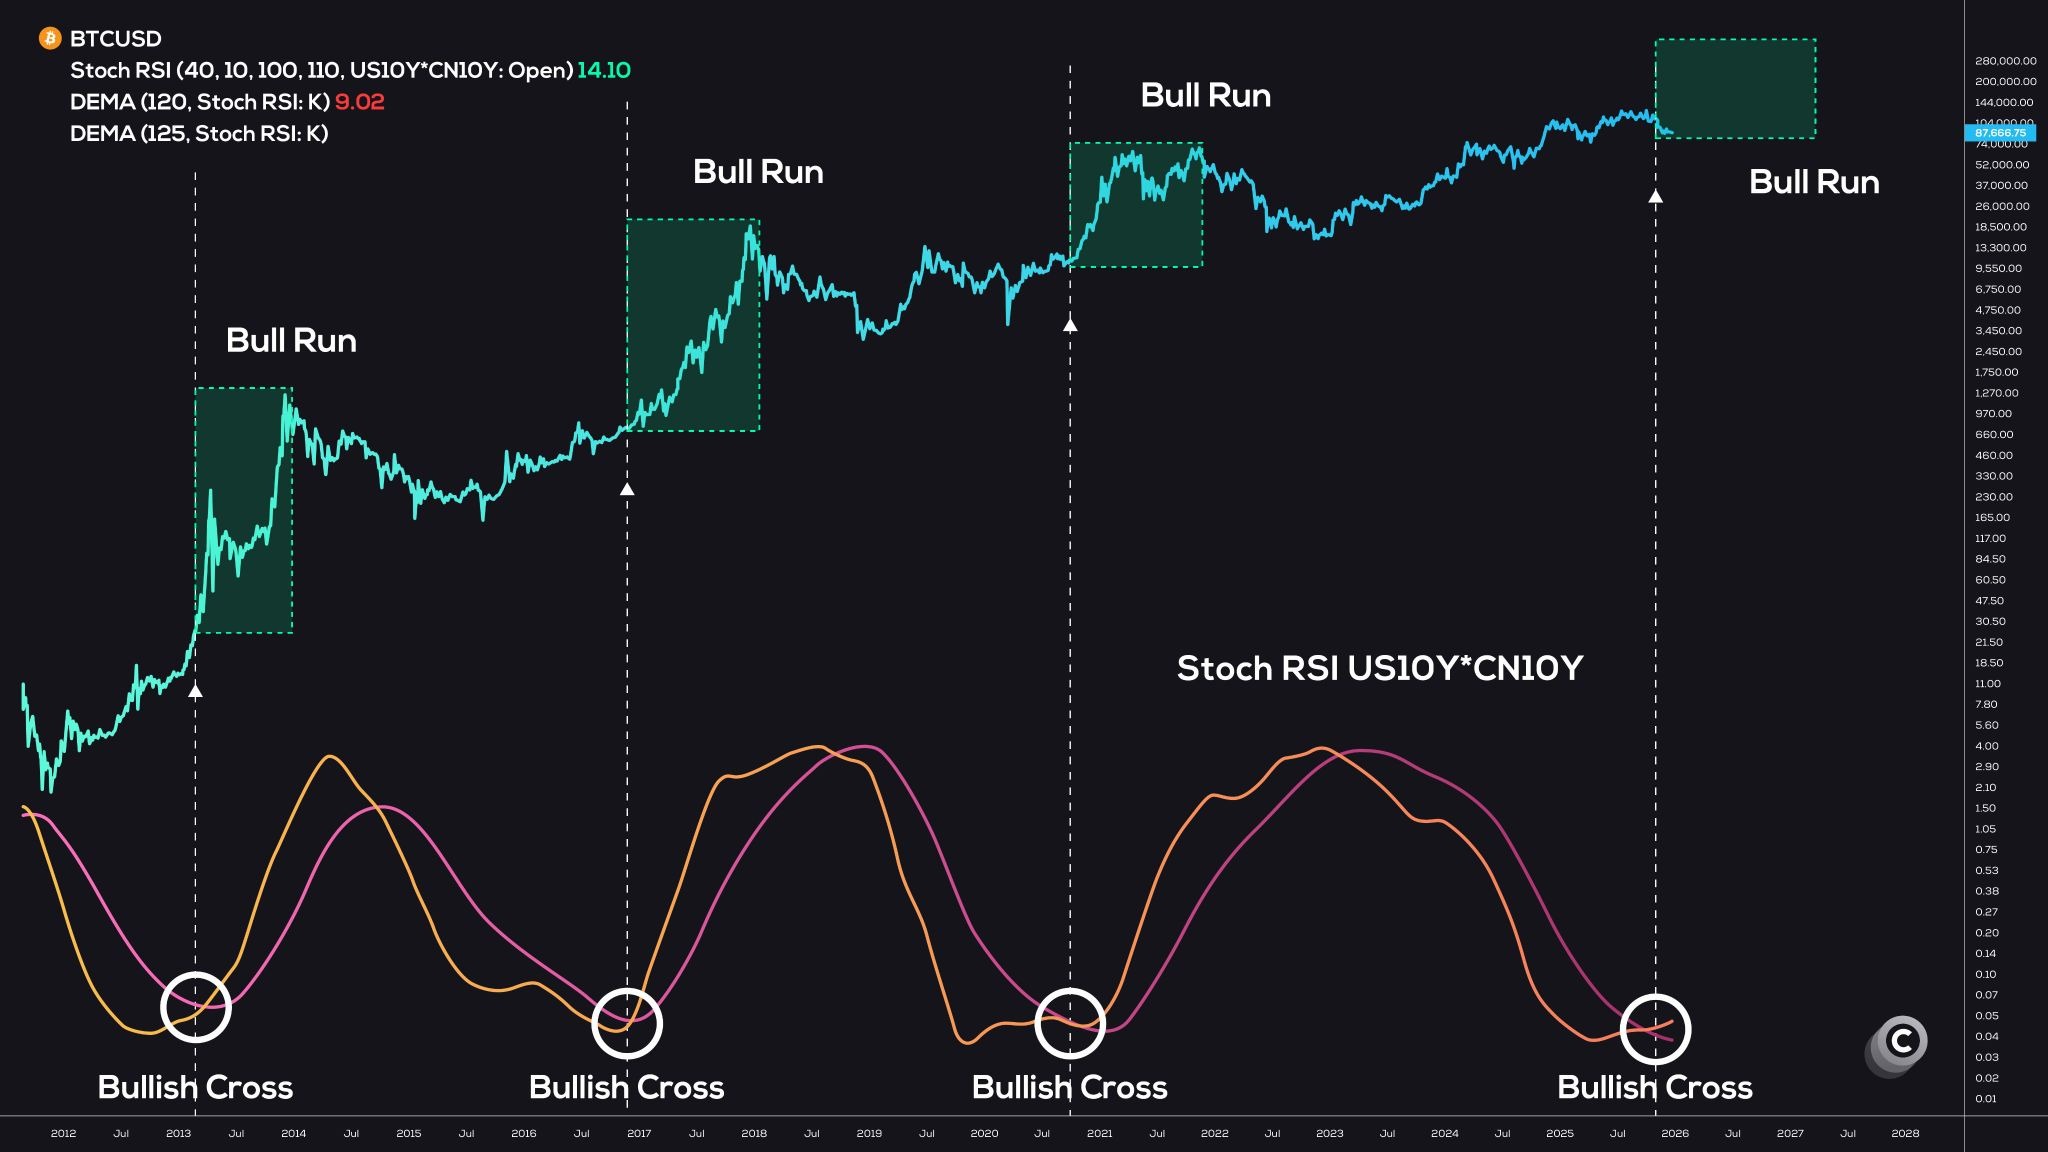
The cryptocurrency world is abuzz with speculation as a historically accurate bullish signal for Bitcoin has emerged, igniting hopes for a significant price surge. The signal, spotted by analyst Coinvo Trading, involves a bullish cross on the weekly chart of the Stochastic RSI of the United States 10-Year Treasury Yield (US10Y) and China 10-Year Government Bond Yield (CN10Y) against Bitcoin. This specific pattern has only appeared four other times, each time preceding massive Bitcoin rallies. The last instance, in October 2020, heralded a 600% surge in Bitcoin‘s price, culminating in the 2021 all-time highs.
The Significance of Treasury Yields
The use of treasury yields as a leading indicator might seem unconventional, but it highlights the interconnectedness of global financial markets. These yield curves often reflect investor sentiment regarding economic growth and inflation, factors that can significantly influence the demand for risk assets like Bitcoin. A bullish cross in this context suggests a shift towards risk-on sentiment, potentially fueling Bitcoin‘s upward trajectory. This type of analysis emphasizes how macroeconomics can influence the crypto markets.

On-Chain Data: A Contrasting Narrative
While the technical signal provides a bullish outlook, on-chain data presents a more nuanced picture. The spot cumulative volume delta (CVD) metric, which tracks the difference between buying and selling volumes, has turned sharply negative, indicating a dominance of sell-side pressure. The data from Glassnode shows a significant decline in CVD, pointing to a risk-off sentiment among traders. Furthermore, spot Bitcoin ETF weekly net flows have flipped from inflows to outflows, signaling cooling institutional demand, and increasing downside pressure. This dichotomy showcases the current market’s complexity.
Analyst Perspectives: Further Insights
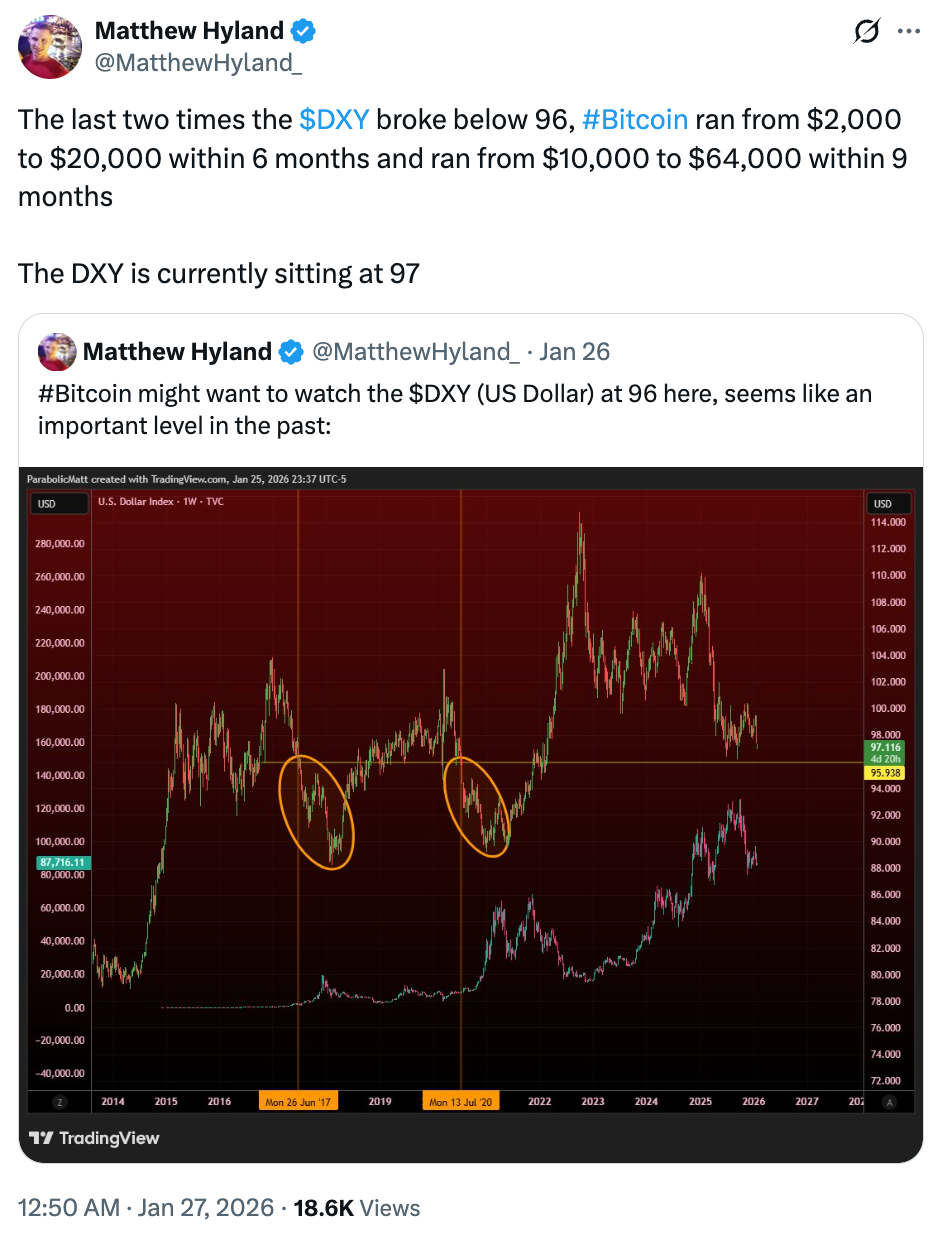
Beyond the technical indicators, other analysts are weighing in. Matthew Hyland suggests that a break below 96 for the US dollar strength index (DXY) could be another catalyst for a Bitcoin rally, drawing parallels to previous periods of price appreciation. Additionally, the divergence between Bitcoin and gold, with gold reaching record highs while Bitcoin remains rangebound, is being observed. Experts suggest this is typical behavior, with Bitcoin often lagging behind gold before experiencing its own significant breakout. Swan analysts suggest investors shouldn’t be concerned, because Bitcoin often consolidates before experiencing dramatic price movements.
Market Fragility and Future Outlook
The confluence of the bullish technical signal and the opposing on-chain data underscores the current fragility of the Bitcoin market. While the historical signal offers hope for a bull run, the persistent sell-side pressure and the shift in investor sentiment suggest that a sustained price recovery could be delayed. The upcoming weeks will be critical in determining whether Bitcoin can overcome the existing resistance and capitalize on the potential bullish momentum, or if market participants continue to adopt a more cautious stance.
- Overall, market conditions have shifted more defensive
- Persistent sell-side pressure suggests the market remains fragile
The market remains uncertain.