

Bitcoin‘s Rebound: A Buying Opportunity?
The recent dip in Bitcoin (BTC) has presented a compelling scenario for traders, with multiple on-chain indicators flashing potential buy signals. Analysis suggests the current price levels may represent a “discount zone,” possibly setting the stage for a short-term rebound. This analysis, coupled with technical chart patterns, paints a picture of optimism, albeit with caveats.
The Puell Multiple: Undervaluation Indicator
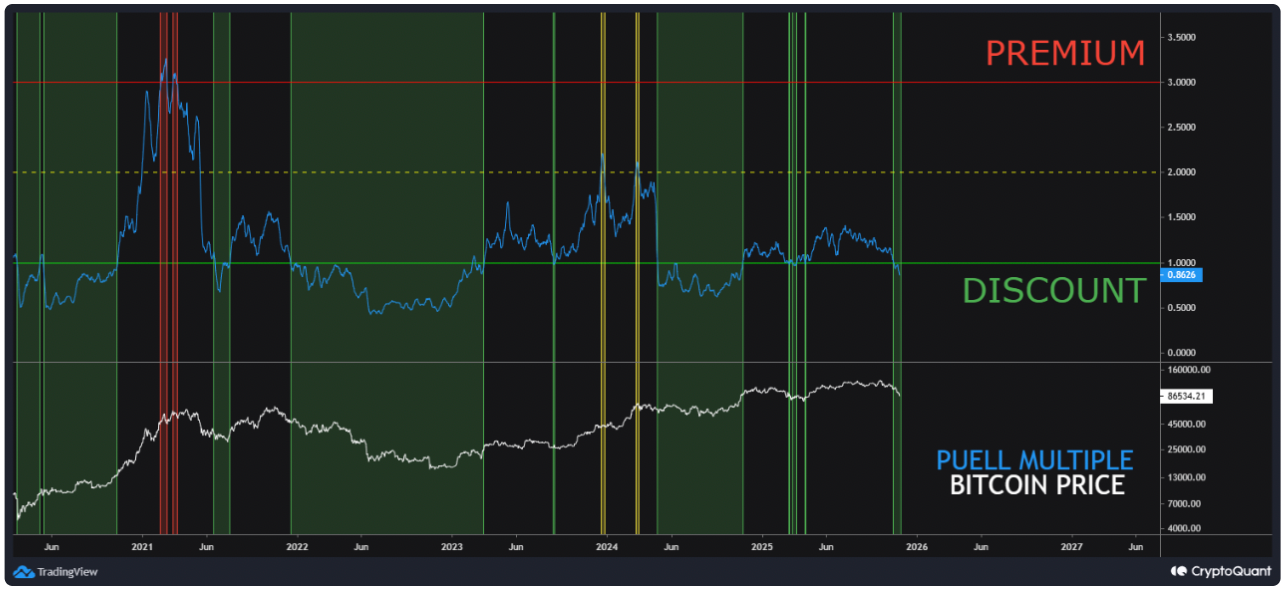
One of the key metrics signaling a possible undervaluation is the Puell Multiple. This indicator assesses miners’ daily revenue against a yearly average. When the Puell Multiple falls below 1, it generally indicates that miners are generating less revenue than usual, which often suggests market weakness or a capitulation event. The recent drop in Bitcoin‘s price has pushed the Puell Multiple into this “discount zone.” Data from CryptoQuant indicates that the metric has fallen to levels similar to those seen in April 2025, which preceded a significant price rally. Analyst Gaah, in a QuickTake analysis, suggests that at these levels, “the market is pricing Bitcoin below its fair value.”
MVRV Z-Score: Approaching Bottom?
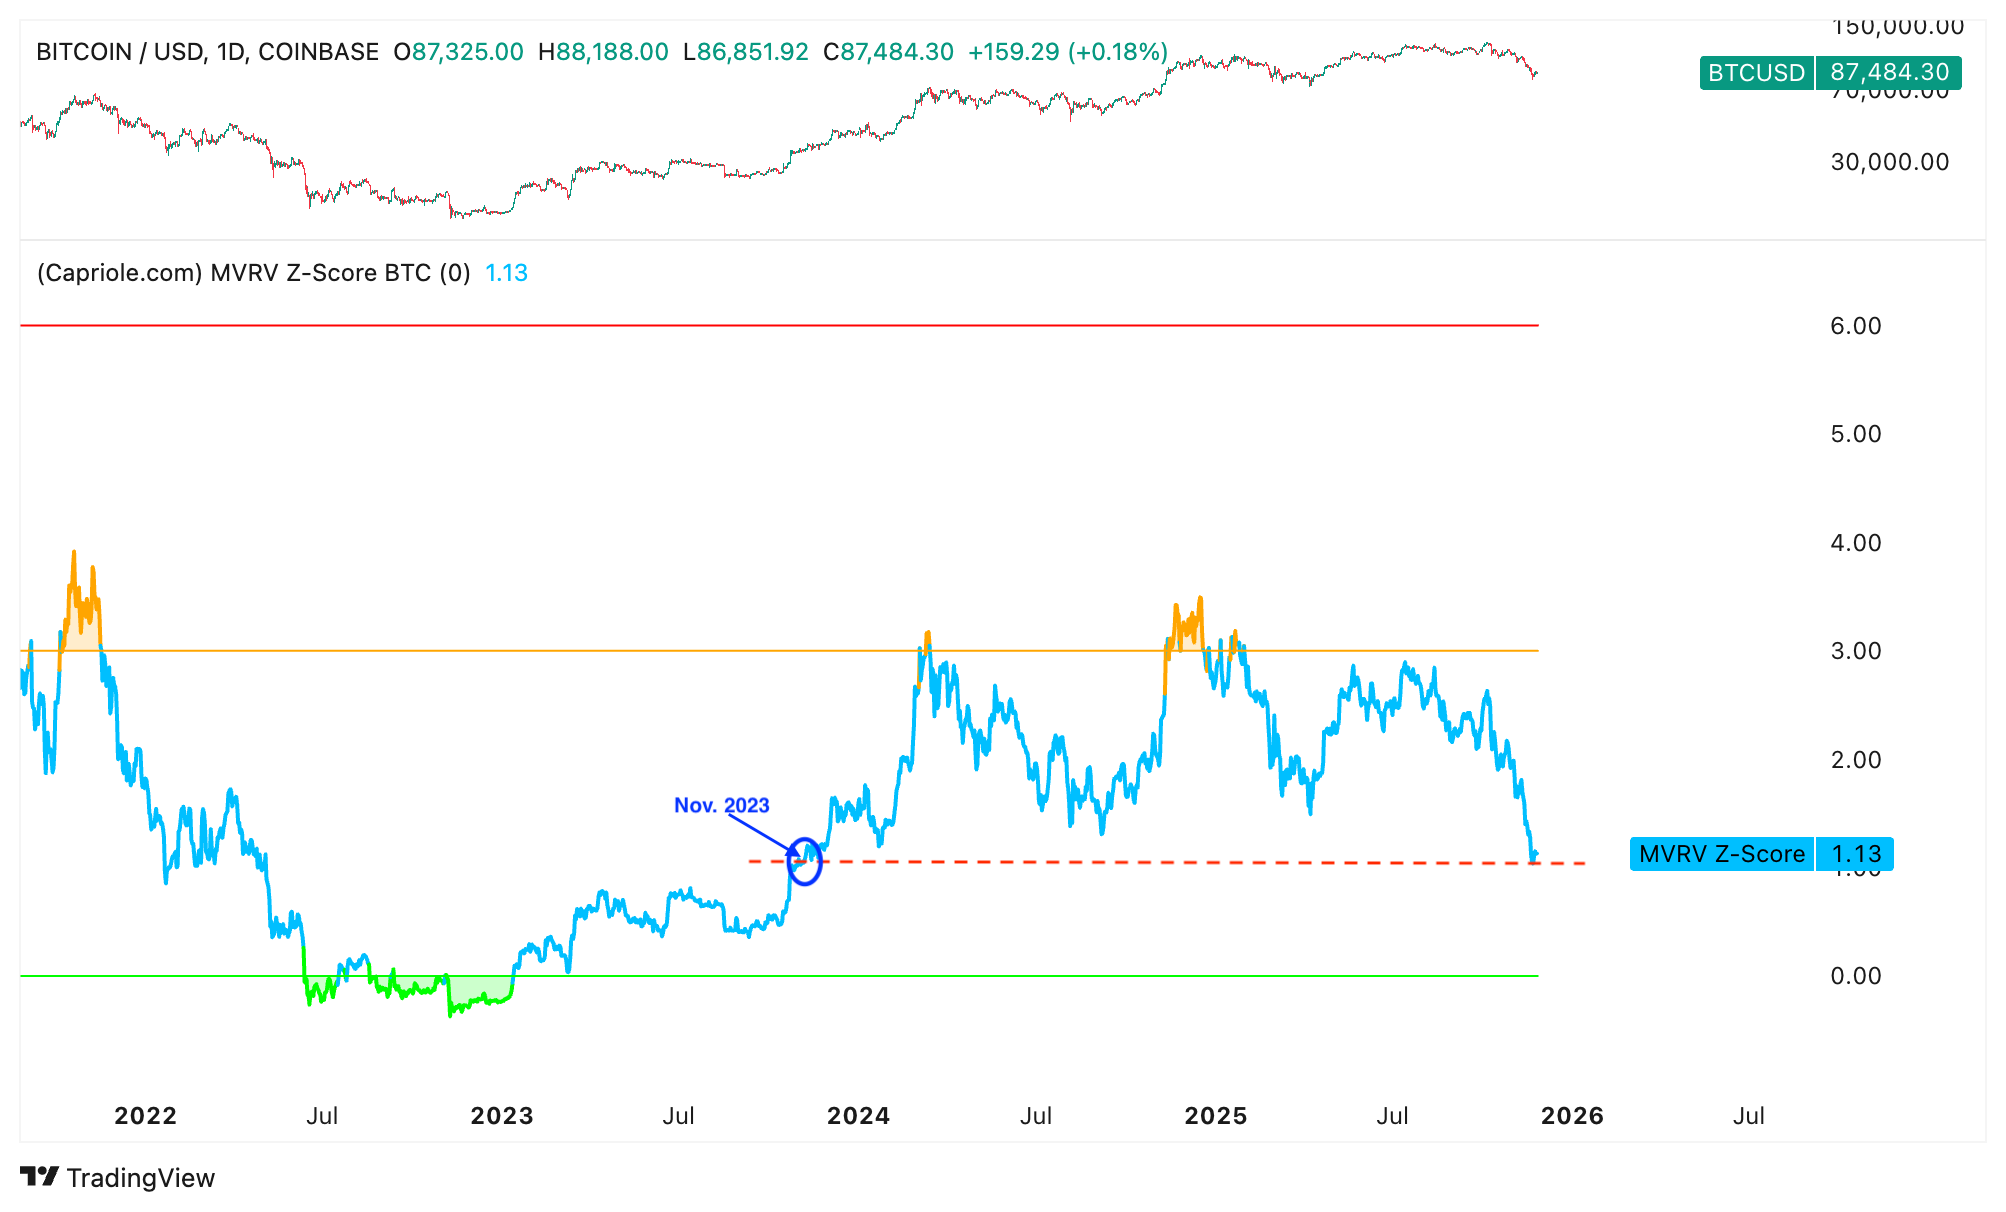
Another metric contributing to the bullish outlook is the MVRV Z-Score, which compares Bitcoin‘s market value to its realized value, adjusted for volatility. Data from Capriole Investments reveals the MVRV Z-Score has recently declined to a two-year low. Historical data indicates that significant drops in the MVRV Z-Score have often marked the end of Bitcoin drawdowns, with the metric eventually crossing below a defined green line. As the MVRV Z-score approaches the green line, the possibility of a local bottom for BTC/USD emerges. A similar situation in late 2023 preceded an 80% price surge.
Technical Analysis: Bull Flag Formation
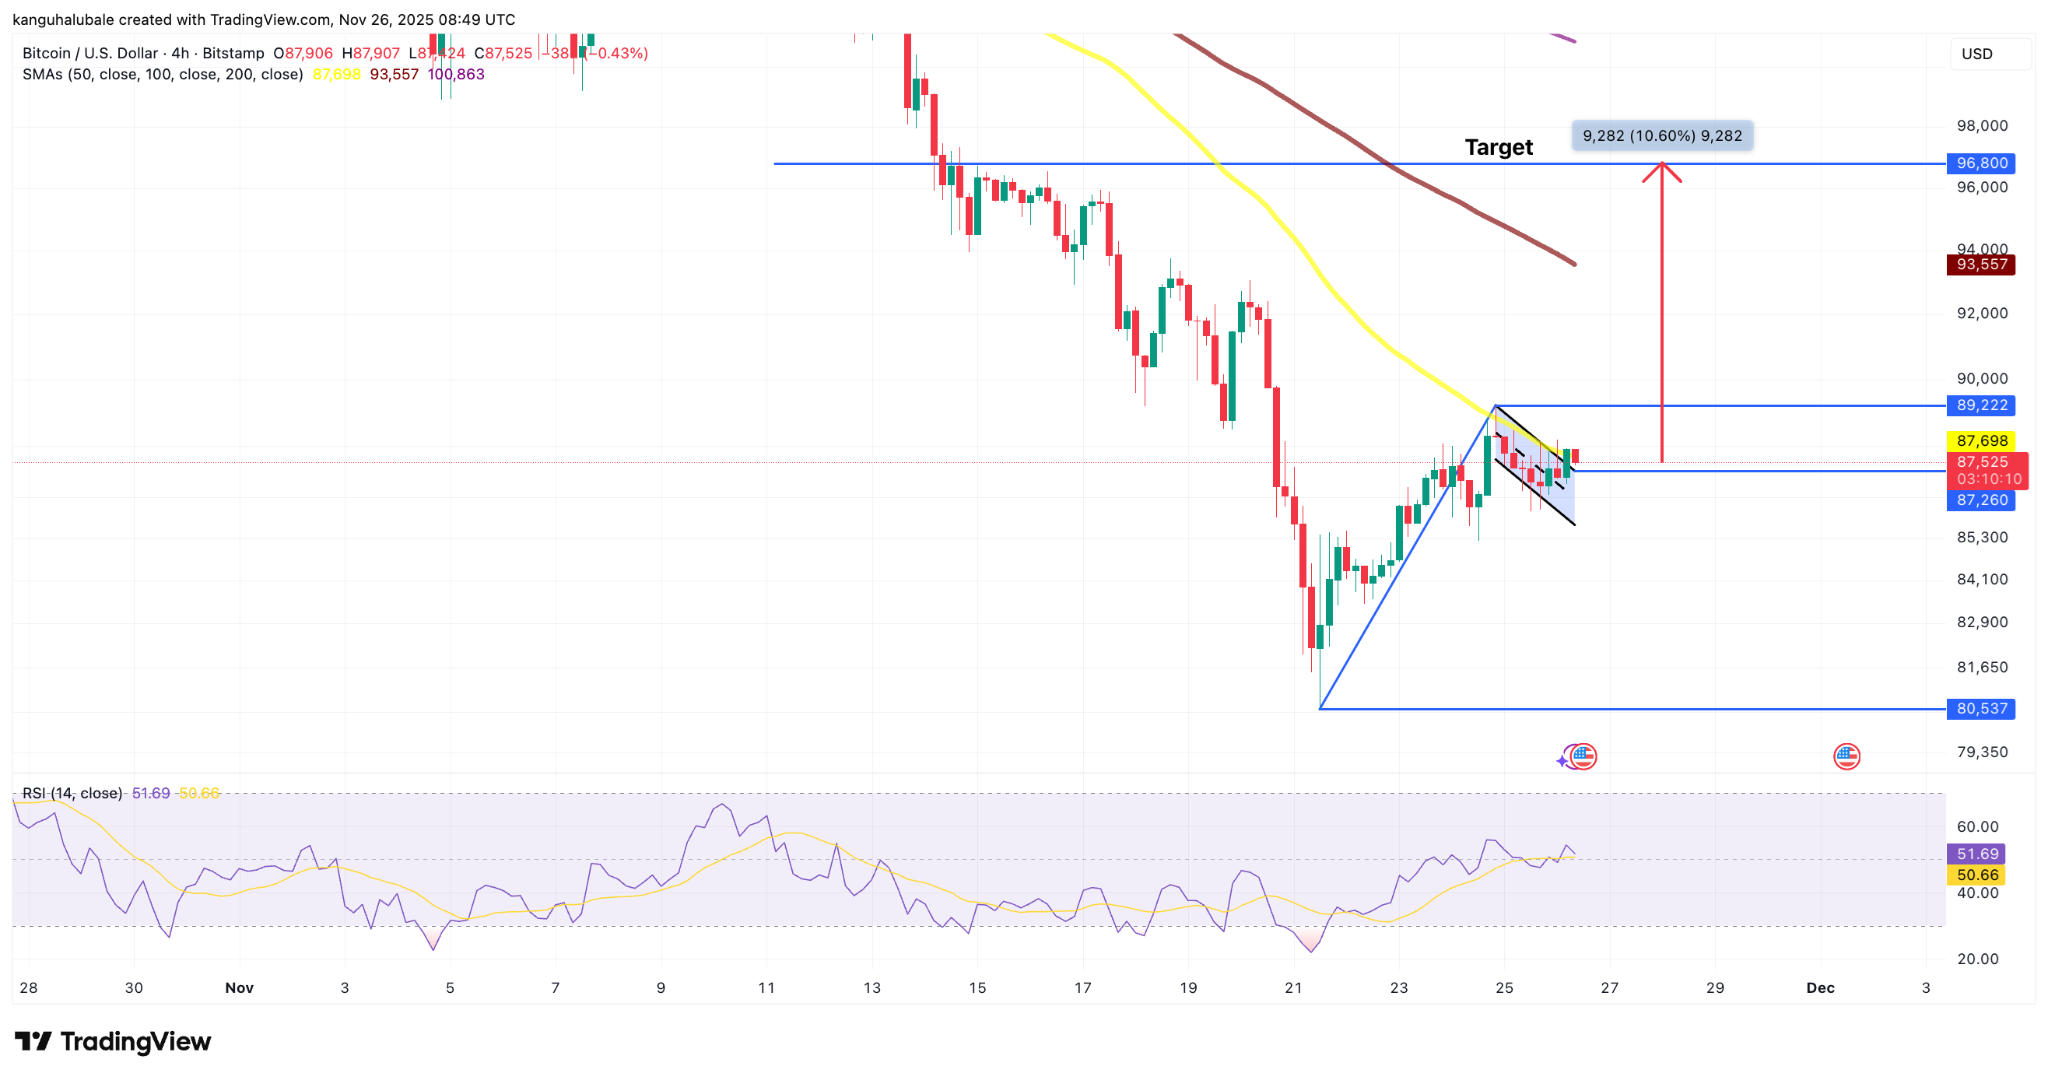
Adding to the bullish narrative, technical analysis points to a potential short-term price target. Bitcoin has already risen approximately 8.6% from its recent lows, and the formation of a bull flag pattern suggests further upside potential. A breakout above the upper trendline of the flag, recently tested and confirmed, could pave the way for a rally. The measured target for this bull flag, as calculated from the pattern, is approximately $96,800, representing a further increase of around 10.6%.
Cautions and Considerations
While the indicators are positive, it’s essential to approach these findings with caution. The possibility of a “dead cat bounce,” as suggested by some veteran traders, cannot be ignored. Furthermore, the market remains volatile, and a final liquidation event below $80,000 is still considered possible by some analysts. Therefore, while the current data suggests a buying opportunity, readers should conduct their own research and be prepared for potential downside risk. The crypto market is dynamic, and prudent risk management is essential.