Bitcoin‘s $107,000 Test: A Critical Juncture
Bitcoin‘s recent surge faced a significant hurdle, as the cryptocurrency failed to decisively break through the $107,000 resistance level. This rejection has put the spotlight on key support levels and has initiated a period of cautious analysis among traders and analysts. The inability to sustain above this threshold suggests potential short-term volatility and a possible retracement, leaving investors to carefully watch the market.
Analyzing the Resistance and Support Dynamics
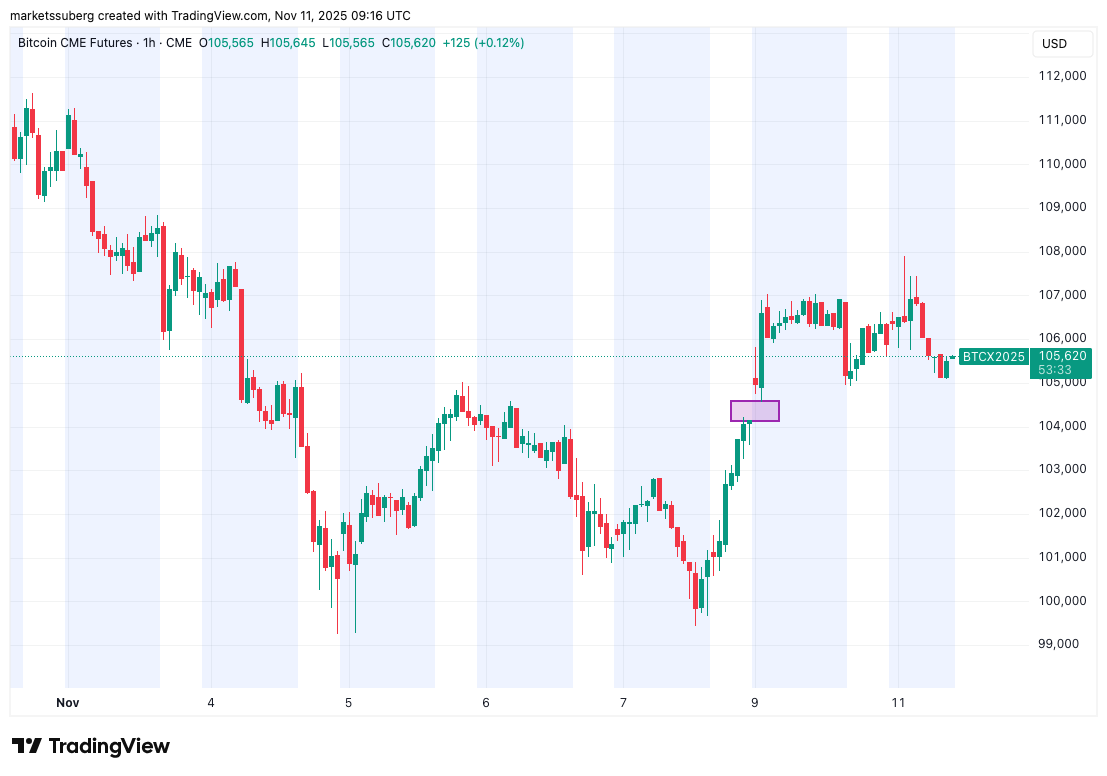
The $107,000 level has emerged as a crucial point, with its failure to hold signifying a potential shift in market sentiment. Several factors are under scrutiny, including the potential for a ‘double top’ pattern, as suggested by some analysts. The presence of a CME gap, currently below the spot price, adds another layer of complexity. If the price were to fill the gap, that could create some buying opportunity.
Expert Insights and Potential Scenarios
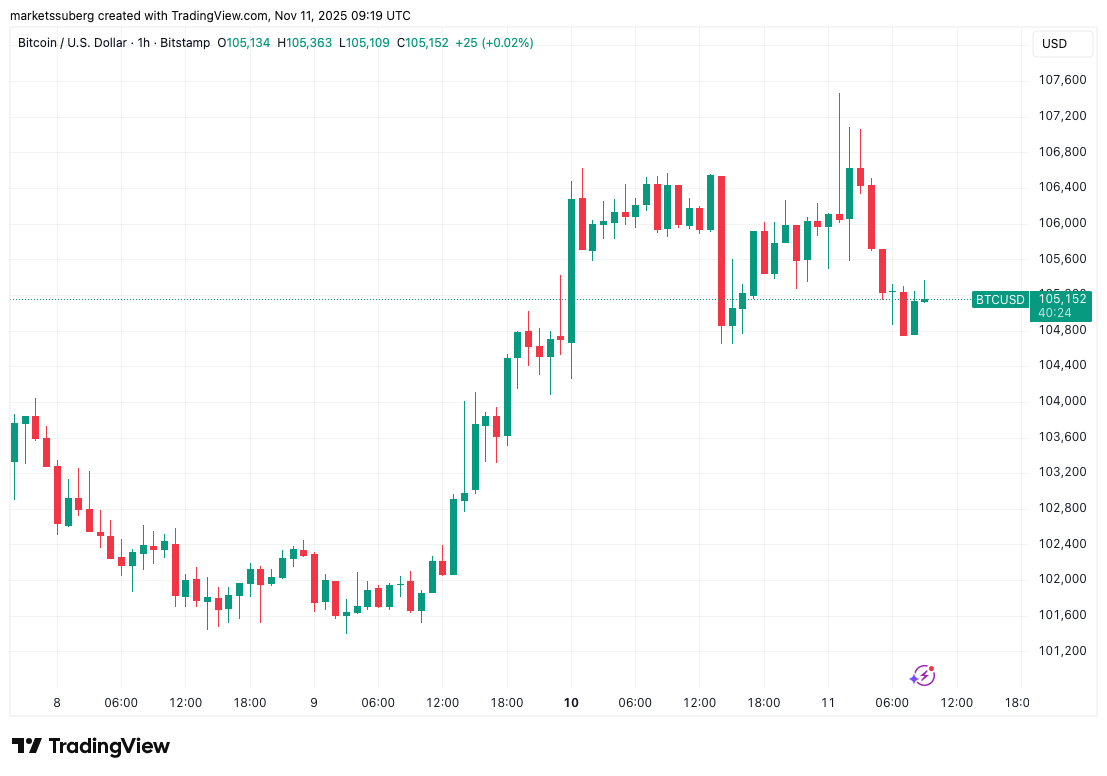
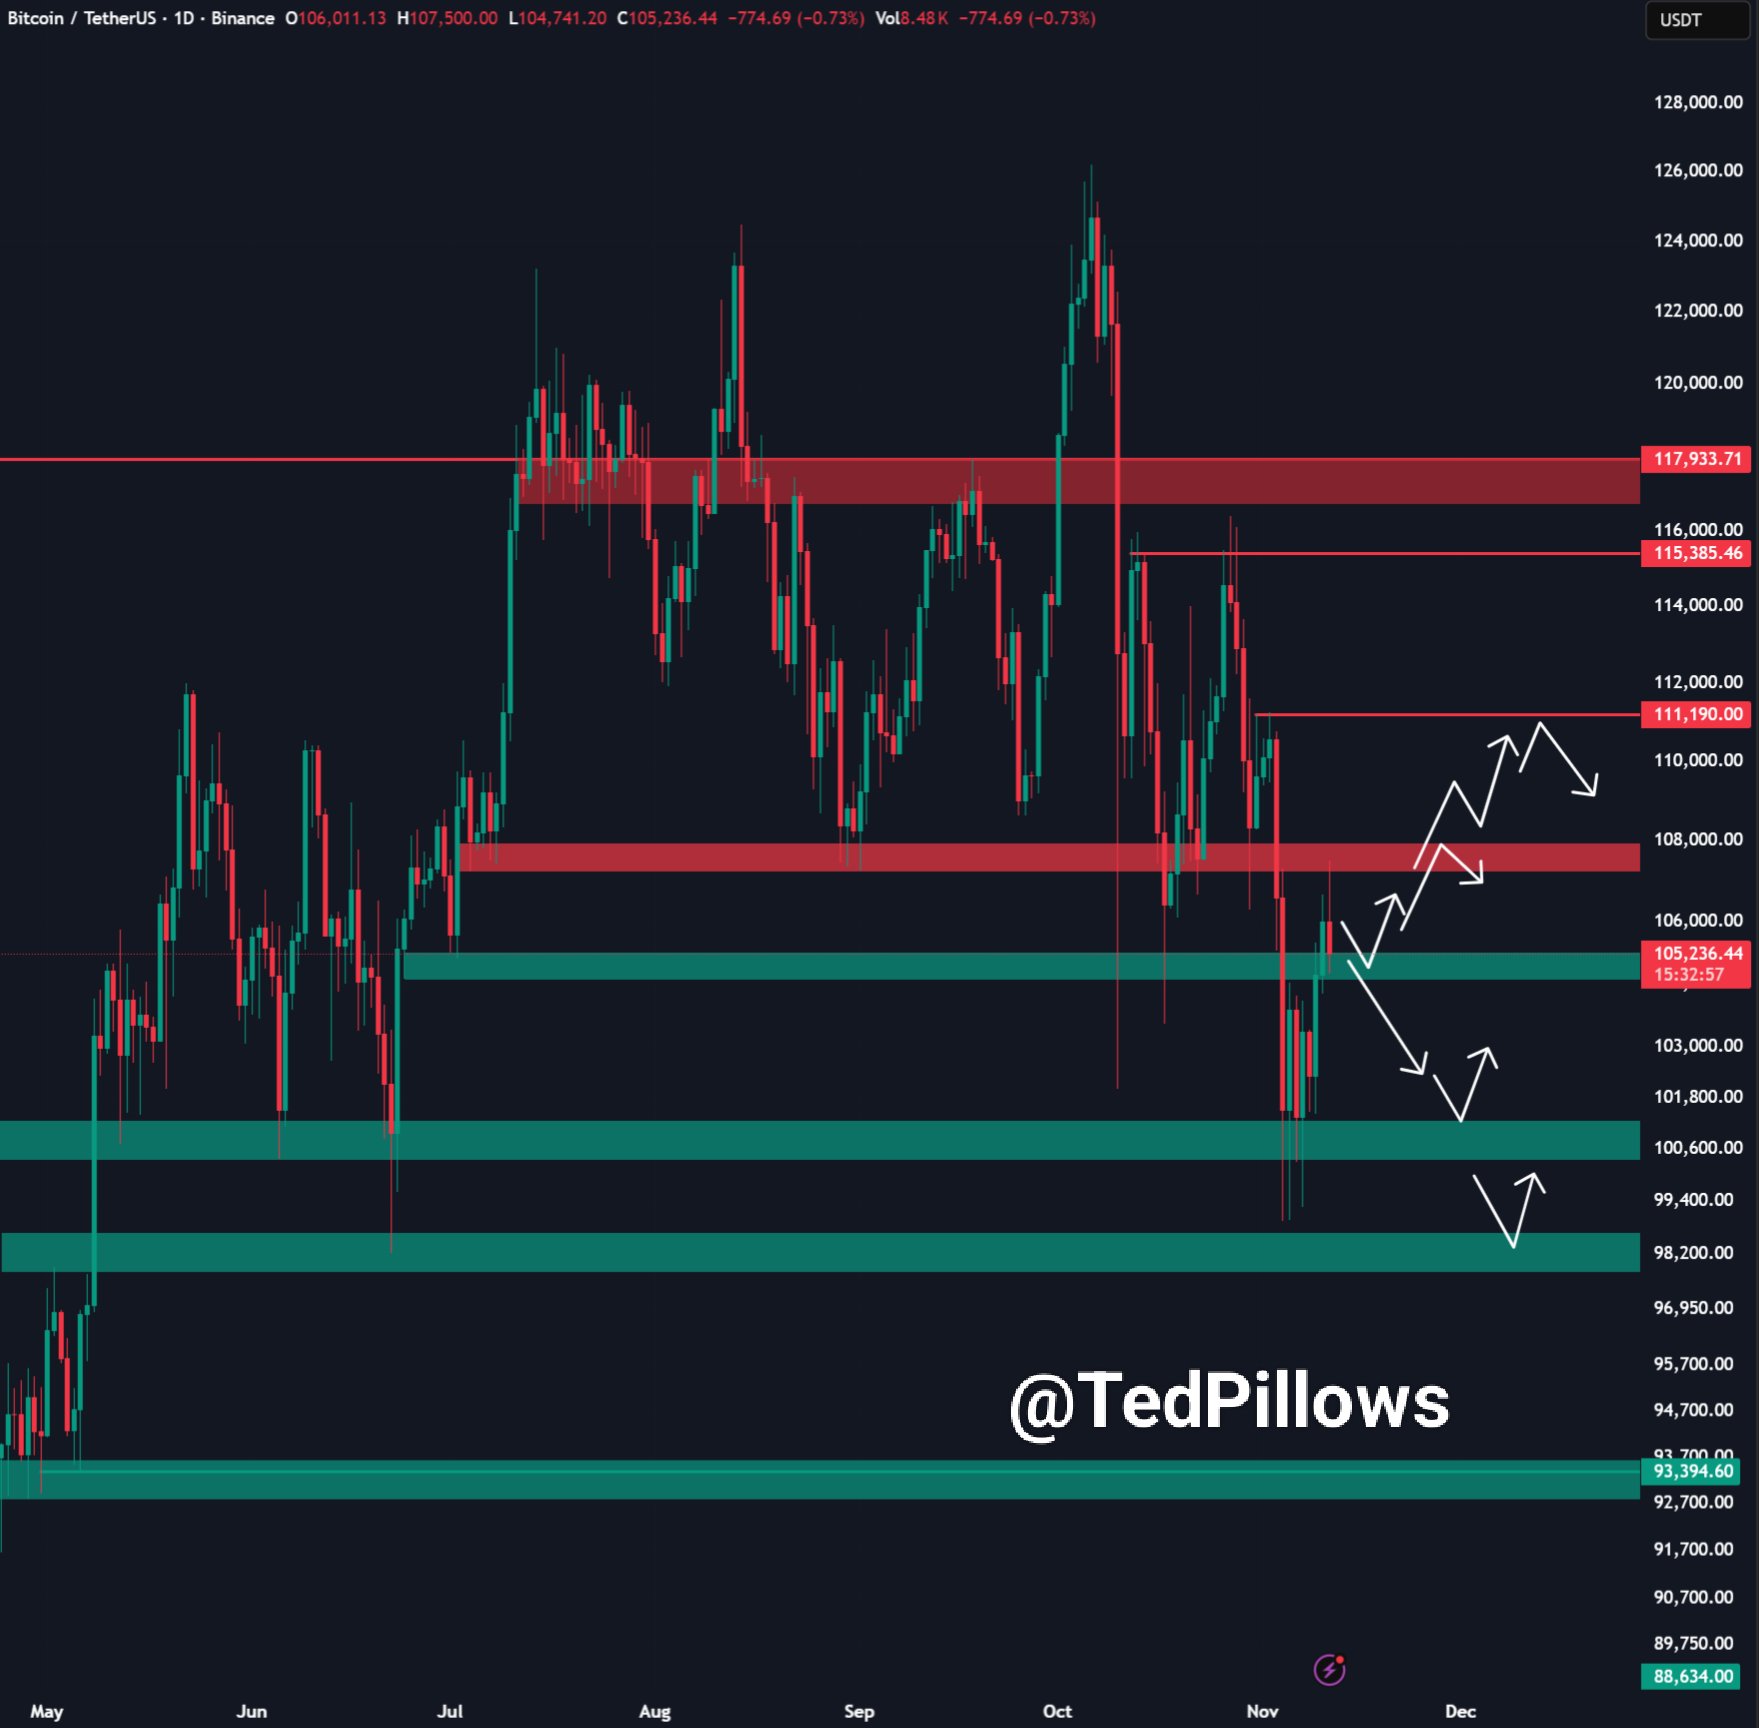
Market observers have offered diverse perspectives on Bitcoin‘s immediate future. Some anticipate a possible retest of the $104,000 support level, with others focusing on the $100,000 region. The ability of Bitcoin to maintain these levels will be crucial in determining the direction of the next move. Not holding those levels can lead to a drop down into the $90,000 – $93,000 range.
Analyst Michael van de Poppe is asking a vital question: “Will $BTC hold at $103K? – Will $BTC hold at $100K and provide a double-bottom test?”
The Impact of Macroeconomic Factors
Beyond technical indicators, broader market conditions and macroeconomic factors play a significant role. The need for a sustained recovery, supported by positive macroeconomic trends and consistent inflows, is seen as crucial for a continued rally. There is currently some “OG selling pressure” above $118,000.
Trading company QCP Capital suggests:
A sustained spot recovery, supported by macro tailwinds and stabilizing ETF inflows, could rekindle demand. However, rallies above $118k are likely to face renewed OG selling pressure. Until long-term holder supply eases, the most probable base case remains a range-bound BTC market in the medium term.
With an understanding of the current market structure and potential upcoming moves, traders can prepare for a range of movements.