

Bitcoin‘s Price Dance: A Technical Correction or a Pause?
Bitcoin, after establishing a fresh all-time high, is currently undergoing a period of price correction. This is a familiar pattern in the volatile world of cryptocurrency, where rapid gains often lead to profit-taking by traders. While the recent surge to $123,218 was undoubtedly exhilarating for many, the subsequent pullback serves as a reminder of Bitcoin‘s cyclical nature. The key question now is whether this correction is merely a technical adjustment or the precursor to a more significant downturn.
Demand Remains Robust: Institutional and Retail Participation
Despite the current price retreat, underlying demand for Bitcoin remains remarkably resilient. Reports from BitcoinTreasuries.NET indicate substantial purchases by Bitcoin treasury companies during the second quarter. Furthermore, the retail investor segment, often referred to as “Shrimp,” “Crab,” and “Fish” holders, continues to demonstrate strong buying interest. According to Bitfinex analysts, the combined demand from these retail groups currently exceeds the monthly supply of newly mined Bitcoin post-halving. This persistent buying pressure is a crucial factor to watch, potentially offsetting the selling activity and supporting a rebound.
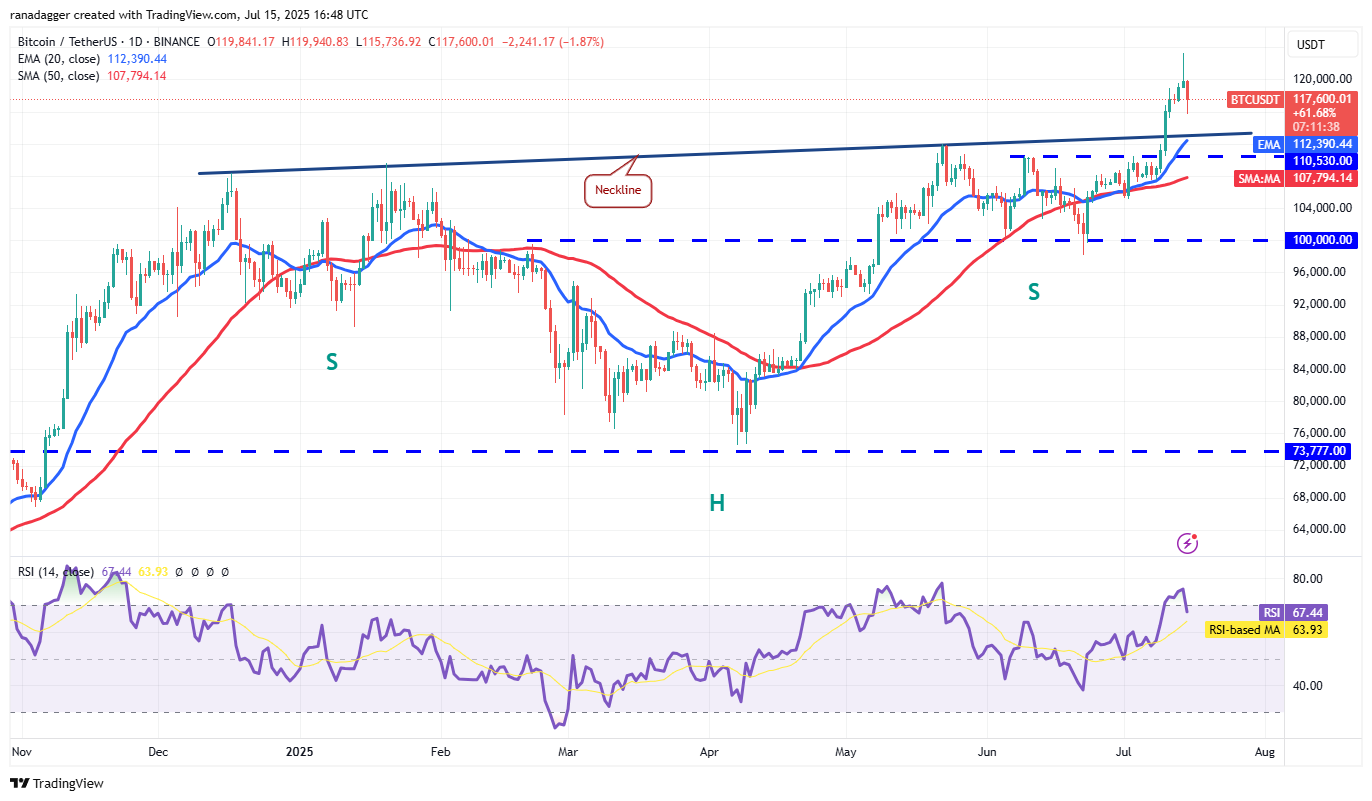
Technical Analysis: Key Levels and Potential Targets
From a technical perspective, the $113,000 level is a critical area of interest. This price point coincides with the neckline of an inverse head-and-shoulders pattern, a bullish formation suggesting a potential price rally. The 20-day exponential moving average (EMA), currently around $112,390, also provides a potential support level. A bounce off this EMA could signal renewed buying interest and potentially propel the price towards the $123,218 resistance level, and ultimately, the pattern target of $150,000. However, a break below the 20-day EMA could indicate a weakening of bullish momentum, potentially leading to a further decline towards the 50-day simple moving average.
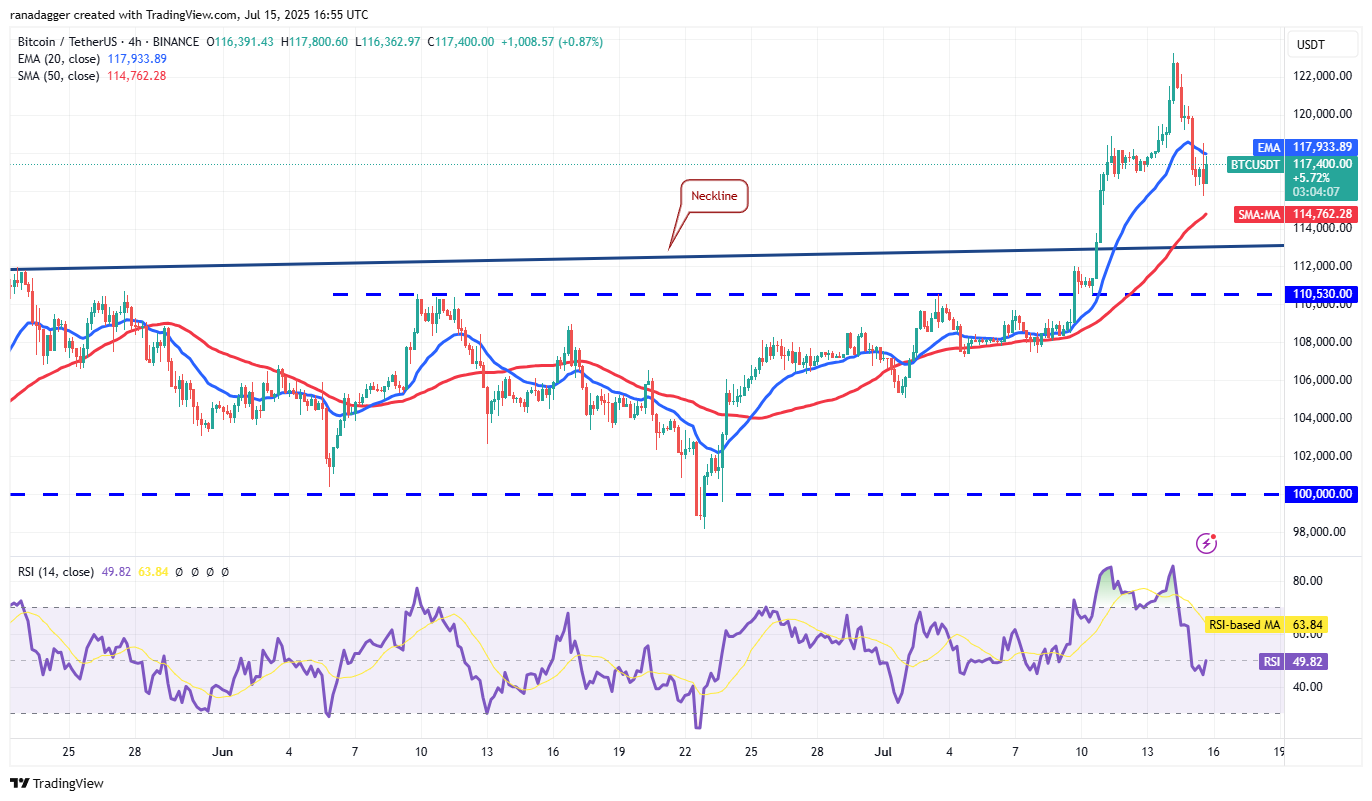
Short-Term Outlook: Navigating the Volatility
On a shorter timeframe, the 4-hour chart reveals some short-term weakness. The price has broken below the 20-EMA, suggesting a potential for further downside movement. Buyers are attempting a relief rally, but they may encounter selling pressure at the 20-EMA. A break below $115,000 could lead to a test of the neckline and support levels near $110,530. A sustained break below this support zone could negate the bullish outlook and lead to a deeper correction. Investors should carefully monitor these key levels for clues about the direction of the next move.
Conclusion: Patience and Prudence are Key
The current situation necessitates a cautious yet optimistic approach. While the pullback is understandable given the recent gains, the underlying demand, particularly from institutional and retail investors, offers a strong foundation for a potential recovery. Traders should closely monitor the key support and resistance levels. Successful navigation of this period will depend on carefully observing market dynamics, managing risk, and making informed decisions based on thorough research. Remember, this analysis is for informational purposes only and should not be considered financial advice.