Bitcoin‘s Sudden Slide: A Market Under Pressure
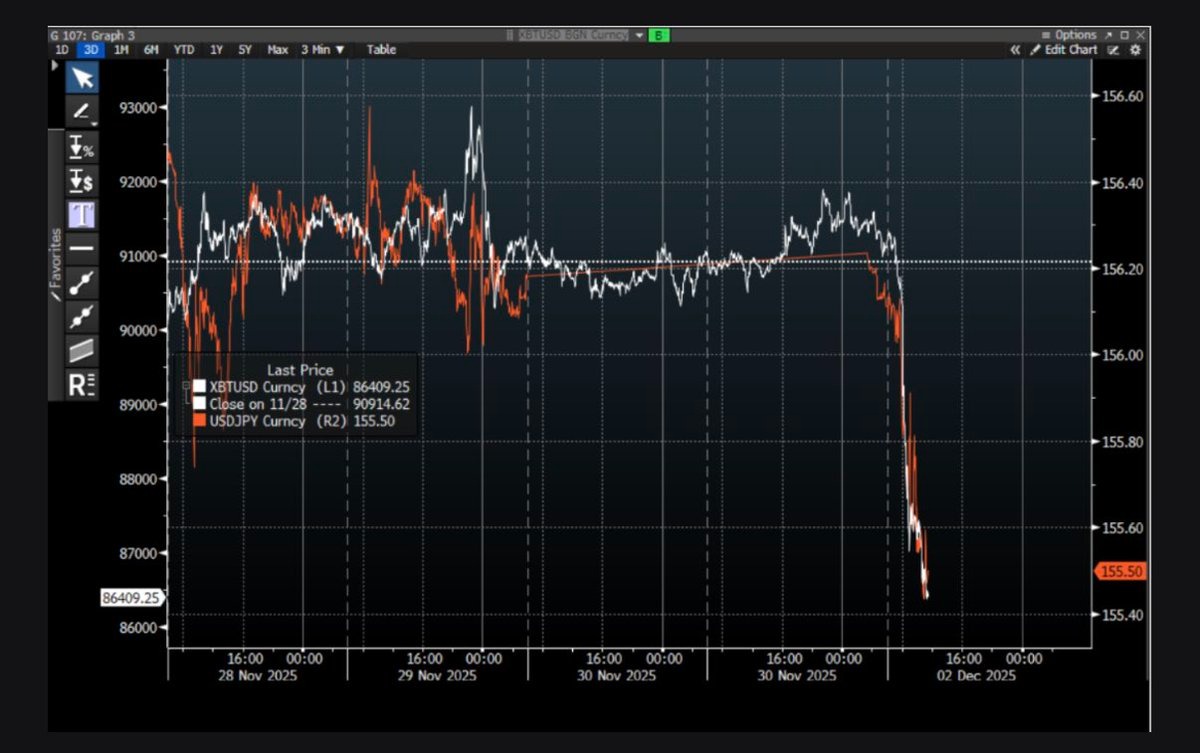
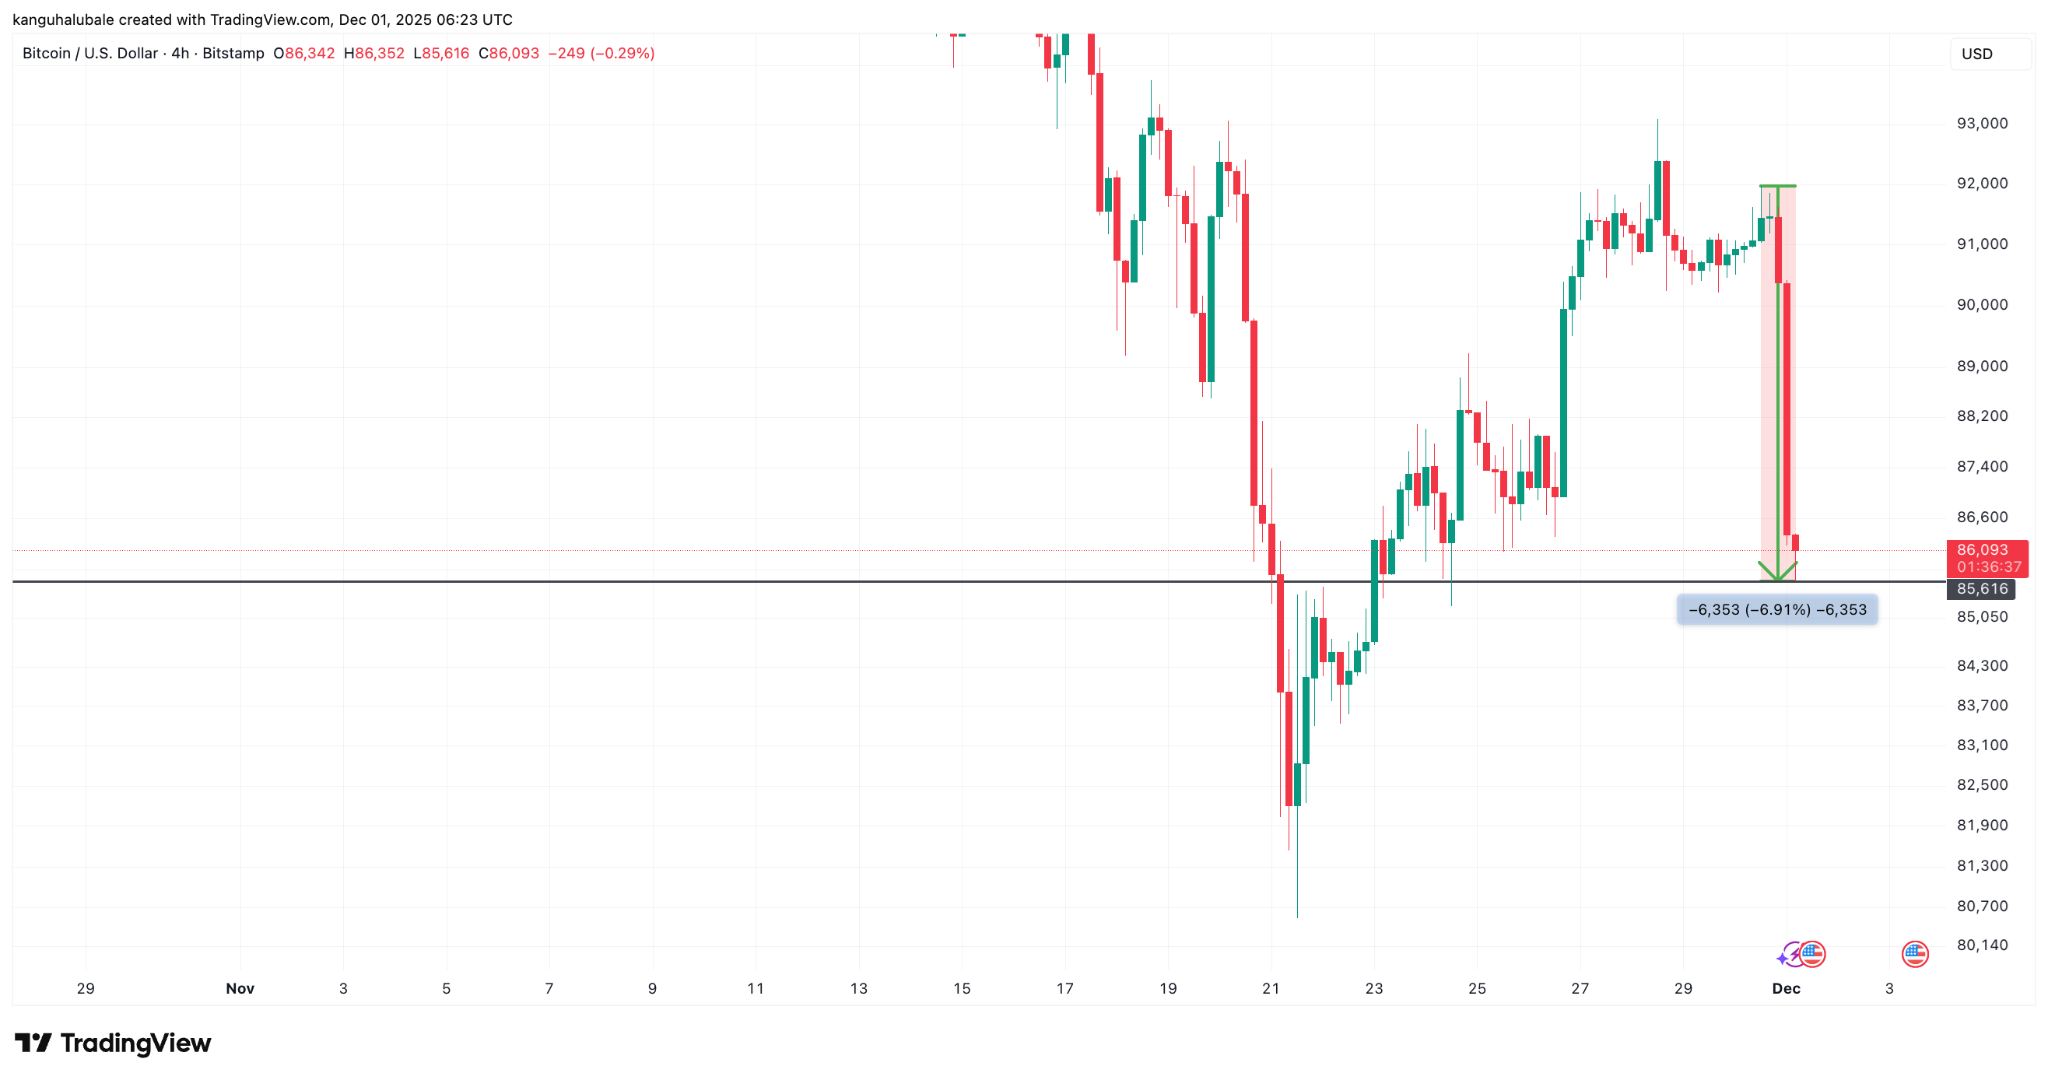
Bitcoin‘s price experienced a sharp downturn, briefly touching $85,000, signaling a period of heightened volatility within the cryptocurrency market. This decline, occurring in early trading sessions, reflects a confluence of factors, foremost among them being growing anticipation of a December rate hike by the Bank of Japan (BoJ). This expectation has sent ripples across financial markets, impacting risk assets like Bitcoin.
The BoJ Factor: A Macroeconomic Headwind
The primary driver behind the recent Bitcoin correction appears to be the potential for the BoJ to tighten monetary policy. An expected rate hike at the December 18-19 meeting, Japan’s first in a considerable period, is causing concern. This potential shift is leading to the unwinding of the substantial yen carry trade. This involves investors borrowing in yen, investing in higher-yielding assets, and the anticipated strengthening of the yen makes these trades less profitable, forcing liquidations.
Market Reaction: Liquidations and Sentiment
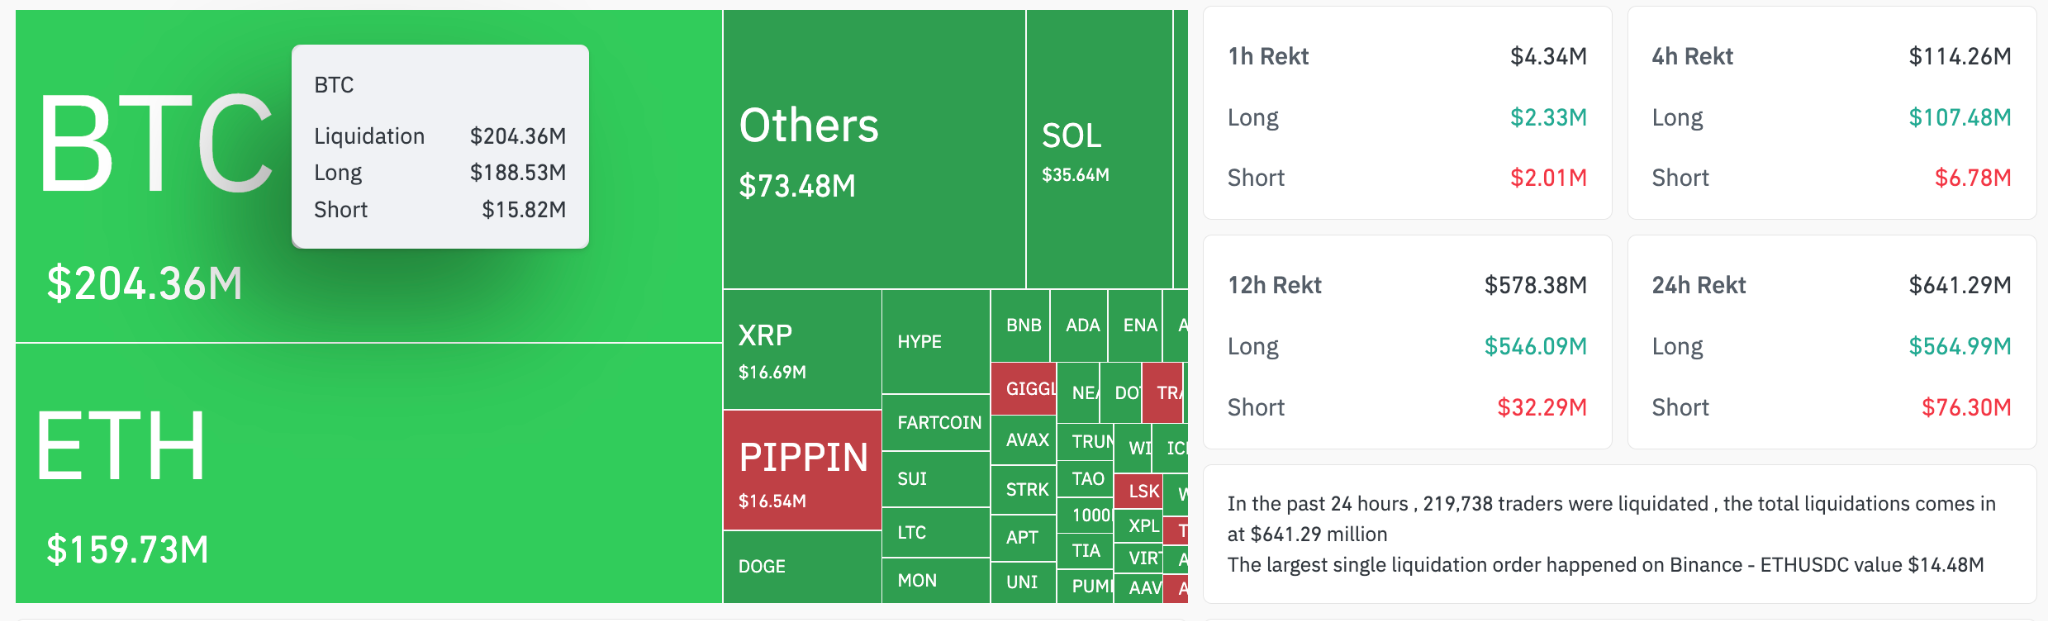
The immediate consequence of these macroeconomic pressures has been a significant wave of liquidations across the cryptocurrency market. Data indicates hundreds of millions of dollars in leveraged positions were wiped out. Bitcoin, and to a lesser extent, Ether (ETH), bore the brunt of these liquidations, amplifying the downward pressure on prices. This sell-off underscores the sensitivity of the crypto market to broader economic trends and investor sentiment.
Technical Analysis: Gauging Potential Downside
From a technical perspective, the Bitcoin price action has raised several red flags. The formation of a bear flag pattern suggests the possibility of further declines. The measured move of this pattern projects a potential drop to around $67,700, a level that would represent a significant correction from recent highs. Analysts are closely monitoring key support levels to assess the likelihood and extent of a potential further downturn.
Looking Ahead: Navigating the Uncertainty
The current market environment presents a complex challenge for Bitcoin investors. The interplay of macroeconomic factors, like the BoJ‘s potential rate hike, and technical indicators are creating an uncertain climate. Key considerations include:
- Interest Rate Hikes: Further hikes by central banks globally will likely impact investor sentiment and risk appetite.
- Liquidations: Monitoring the liquidation levels to understand where significant price support might be found.
- Technical Patterns: Staying vigilant of technical indicators to gauge future price movements.
The recent market action serves as a reminder of the volatility inherent in cryptocurrency investing. Prudent risk management and a thorough understanding of both macroeconomic trends and technical analysis are essential tools for navigating the current market conditions.
The situation requires constant monitoring, but the short-term outlook remains uncertain given the interplay of global factors.