Bitcoin Spot Activity Shows Signs of Life
The Bitcoin (BTC) market is currently exhibiting characteristics that suggest a potential recovery rally. While the broader crypto market remains volatile, on-chain data is providing some interesting insights. Specifically, the Cost Basis Distribution (CBD) is painting a picture of strong buyer conviction, particularly when contrasted with the activity surrounding Ether (ETH).
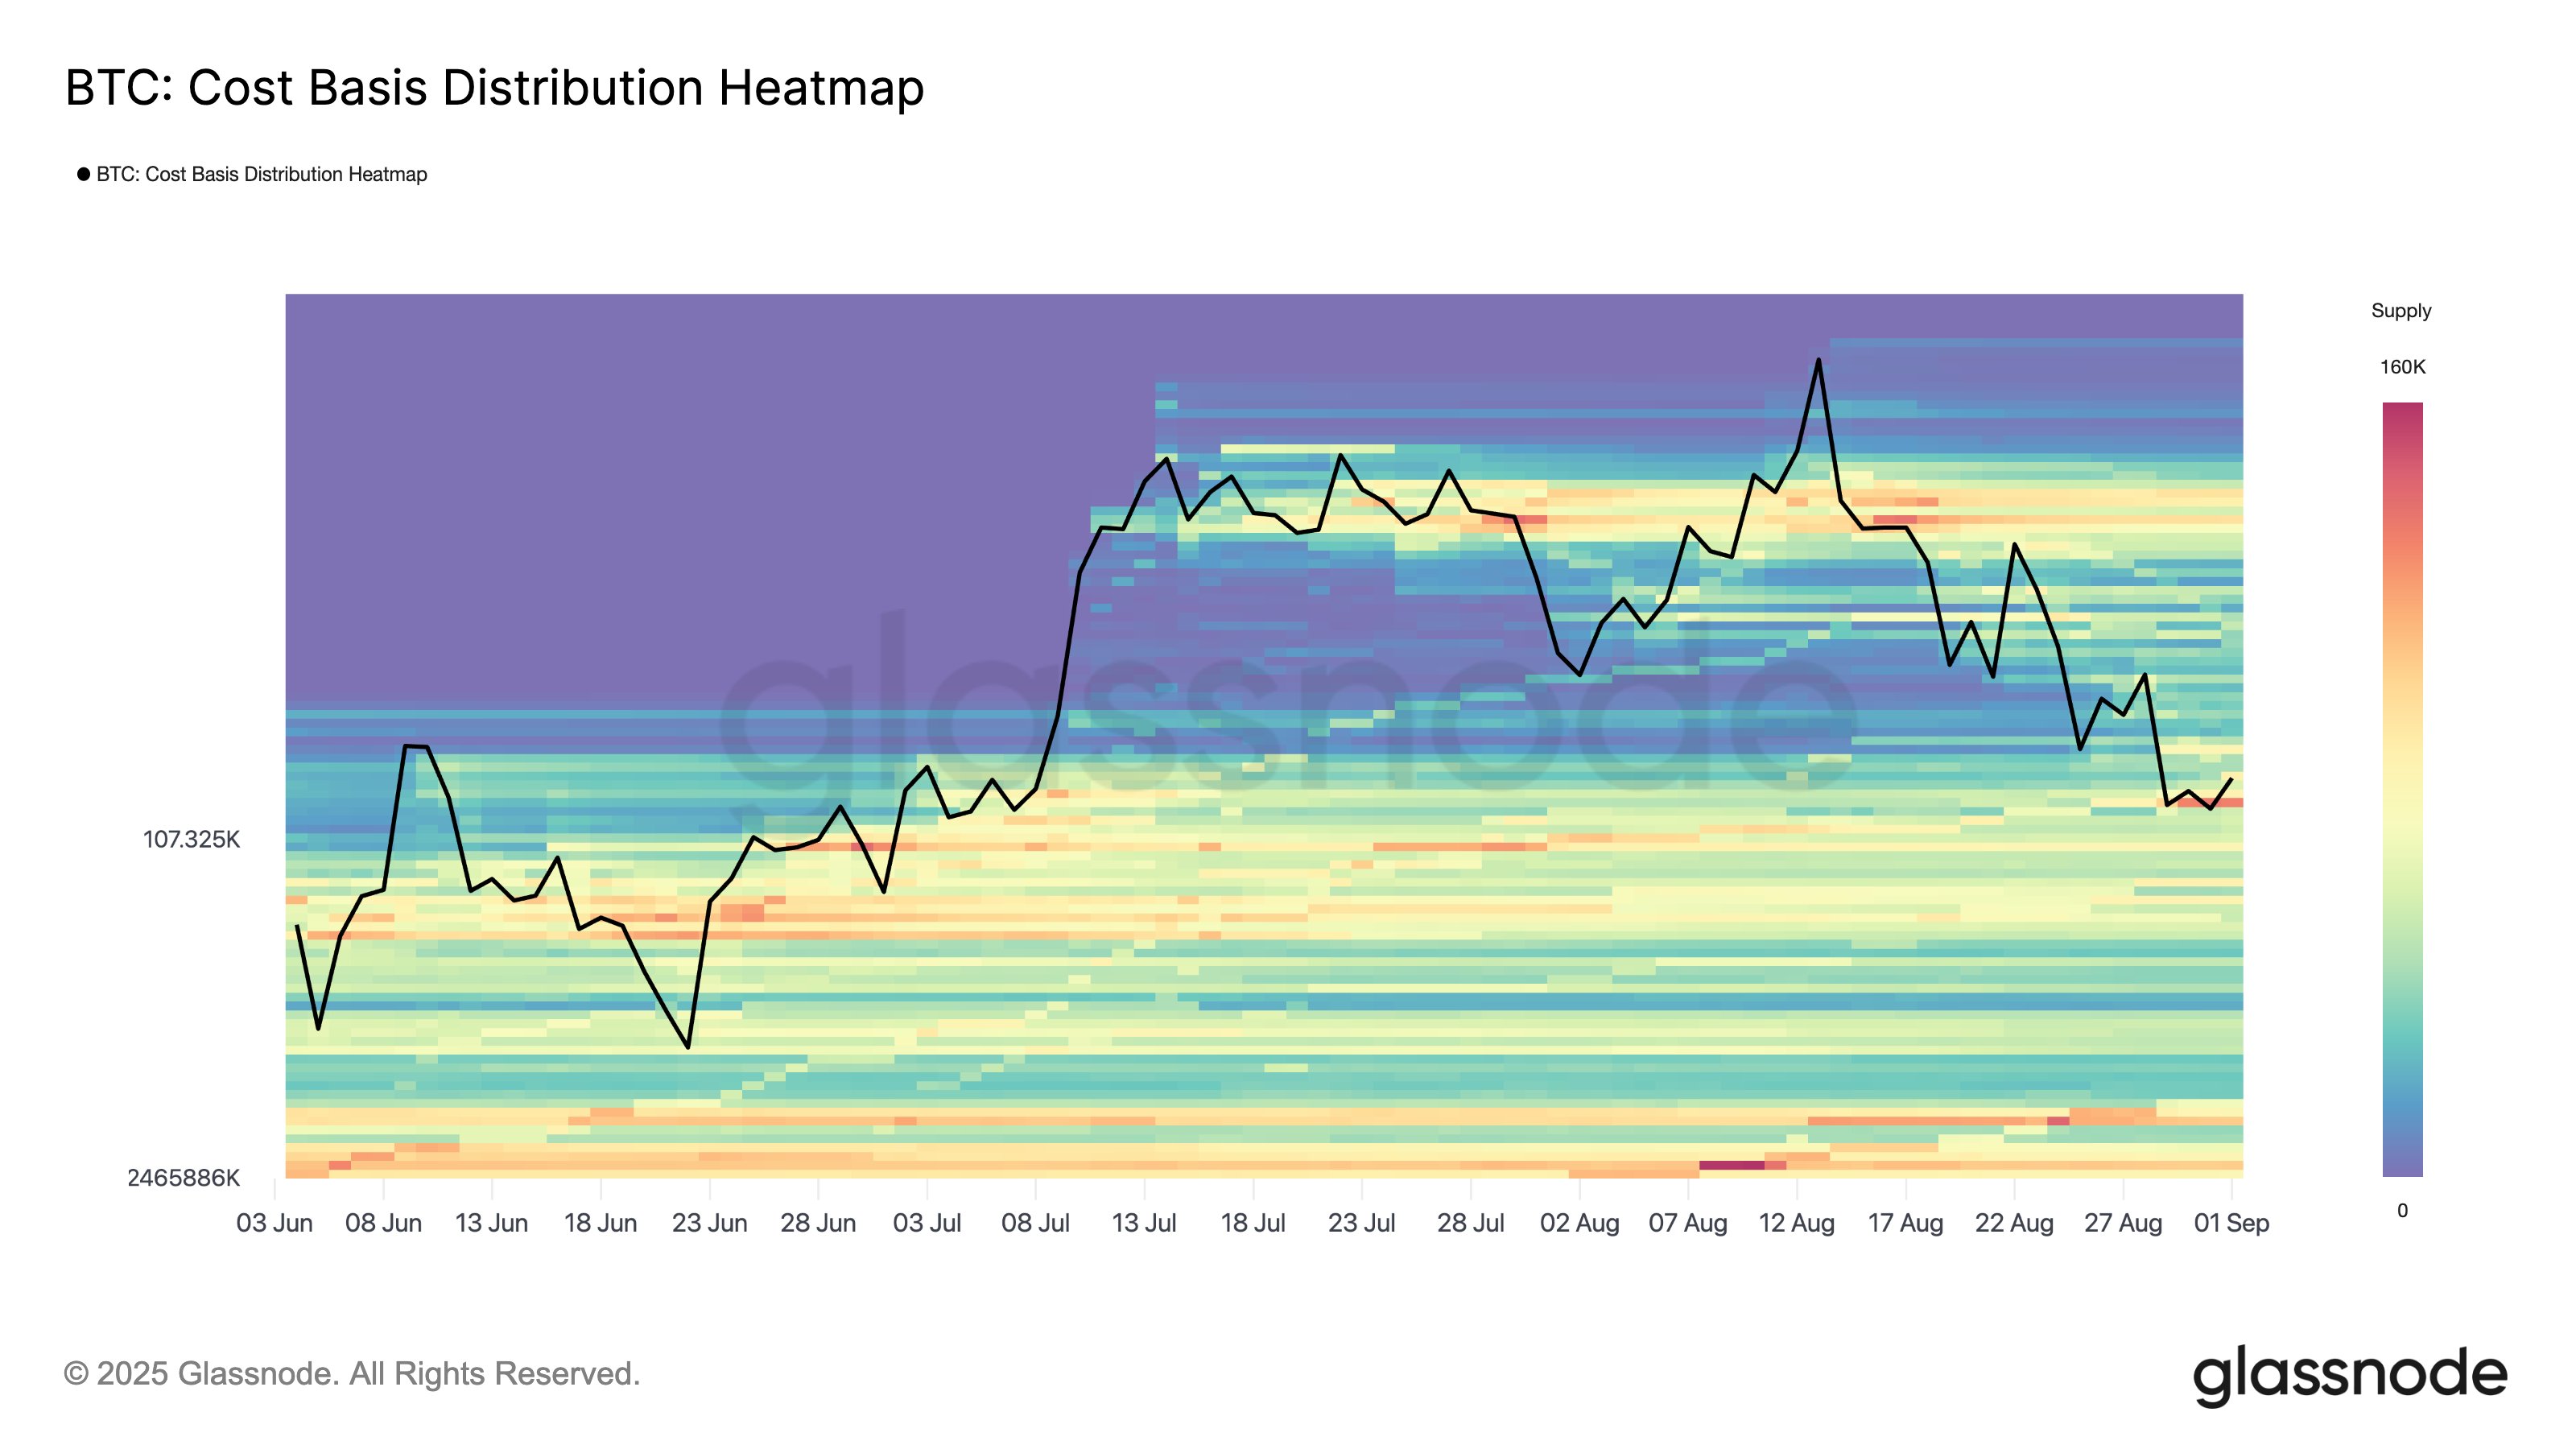
On-Chain Data: Bitcoin vs. Ether
Glassnode’s CBD analysis reveals a divergence. Bitcoin‘s spot market displays denser transaction clustering around recent price levels. This suggests that buyers are actively accumulating BTC. Conversely, Ether’s flows appear sparser, potentially indicating a lack of strong buying interest. The density in Bitcoin‘s trading activity could signify significant support. Historically, such buyer conviction has often provided a more sustainable foundation for price increases compared to momentum driven solely by derivatives.
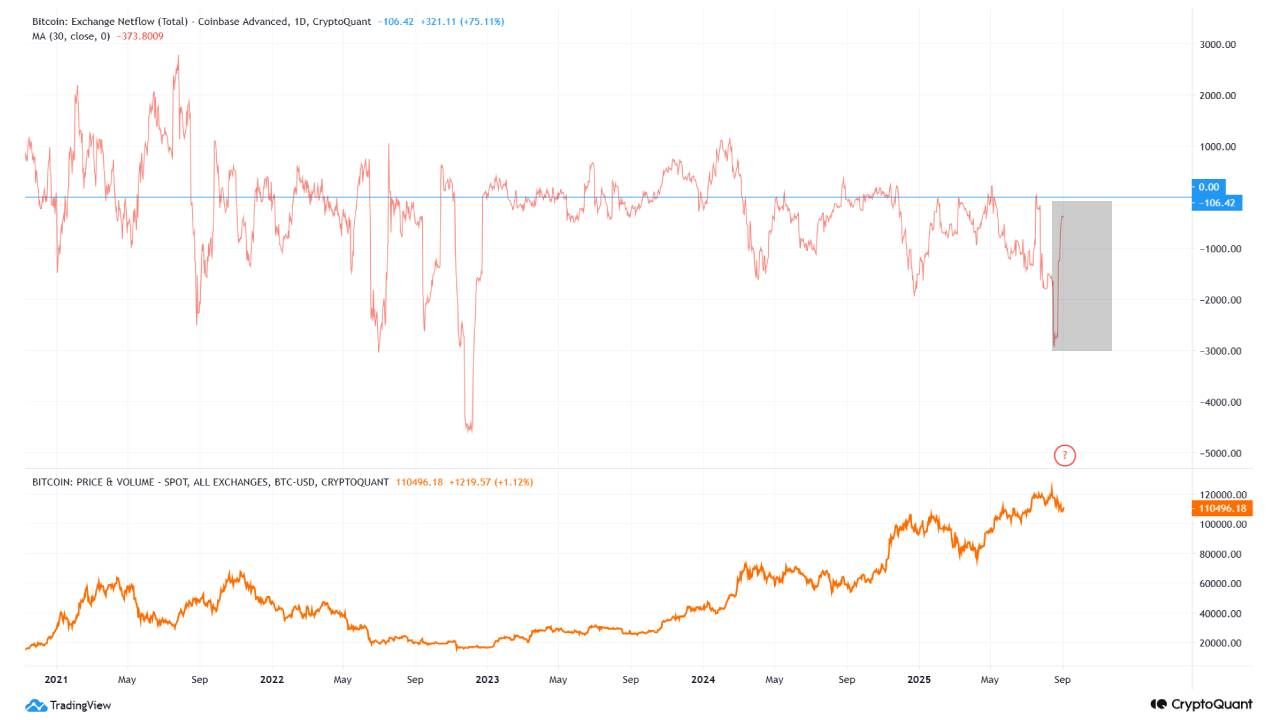
Exchange Flows and Liquidity Shifts
Exchange flows are adding further weight to the bullish narrative. CryptoQuant’s data points to a consistent netflow spike on Coinbase between August 25 and 31. This activity coincided with the lowest level of Coinbase‘s 30-day simple moving average (SMA) since early 2023. Historically, reversals from such troughs have signaled a shift in liquidity, which could be a precursor to increased exchange activity. Simultaneously, Binance‘s 30-day SMA netflow hit its highest since July 2024 on July 25 and August 25, often accompanying phases of accumulation before reaching new highs. This simultaneous divergence, with a Coinbase trough and a Binance peak, suggests a potential redistribution of reserves, potentially paving the way for an upward price movement.
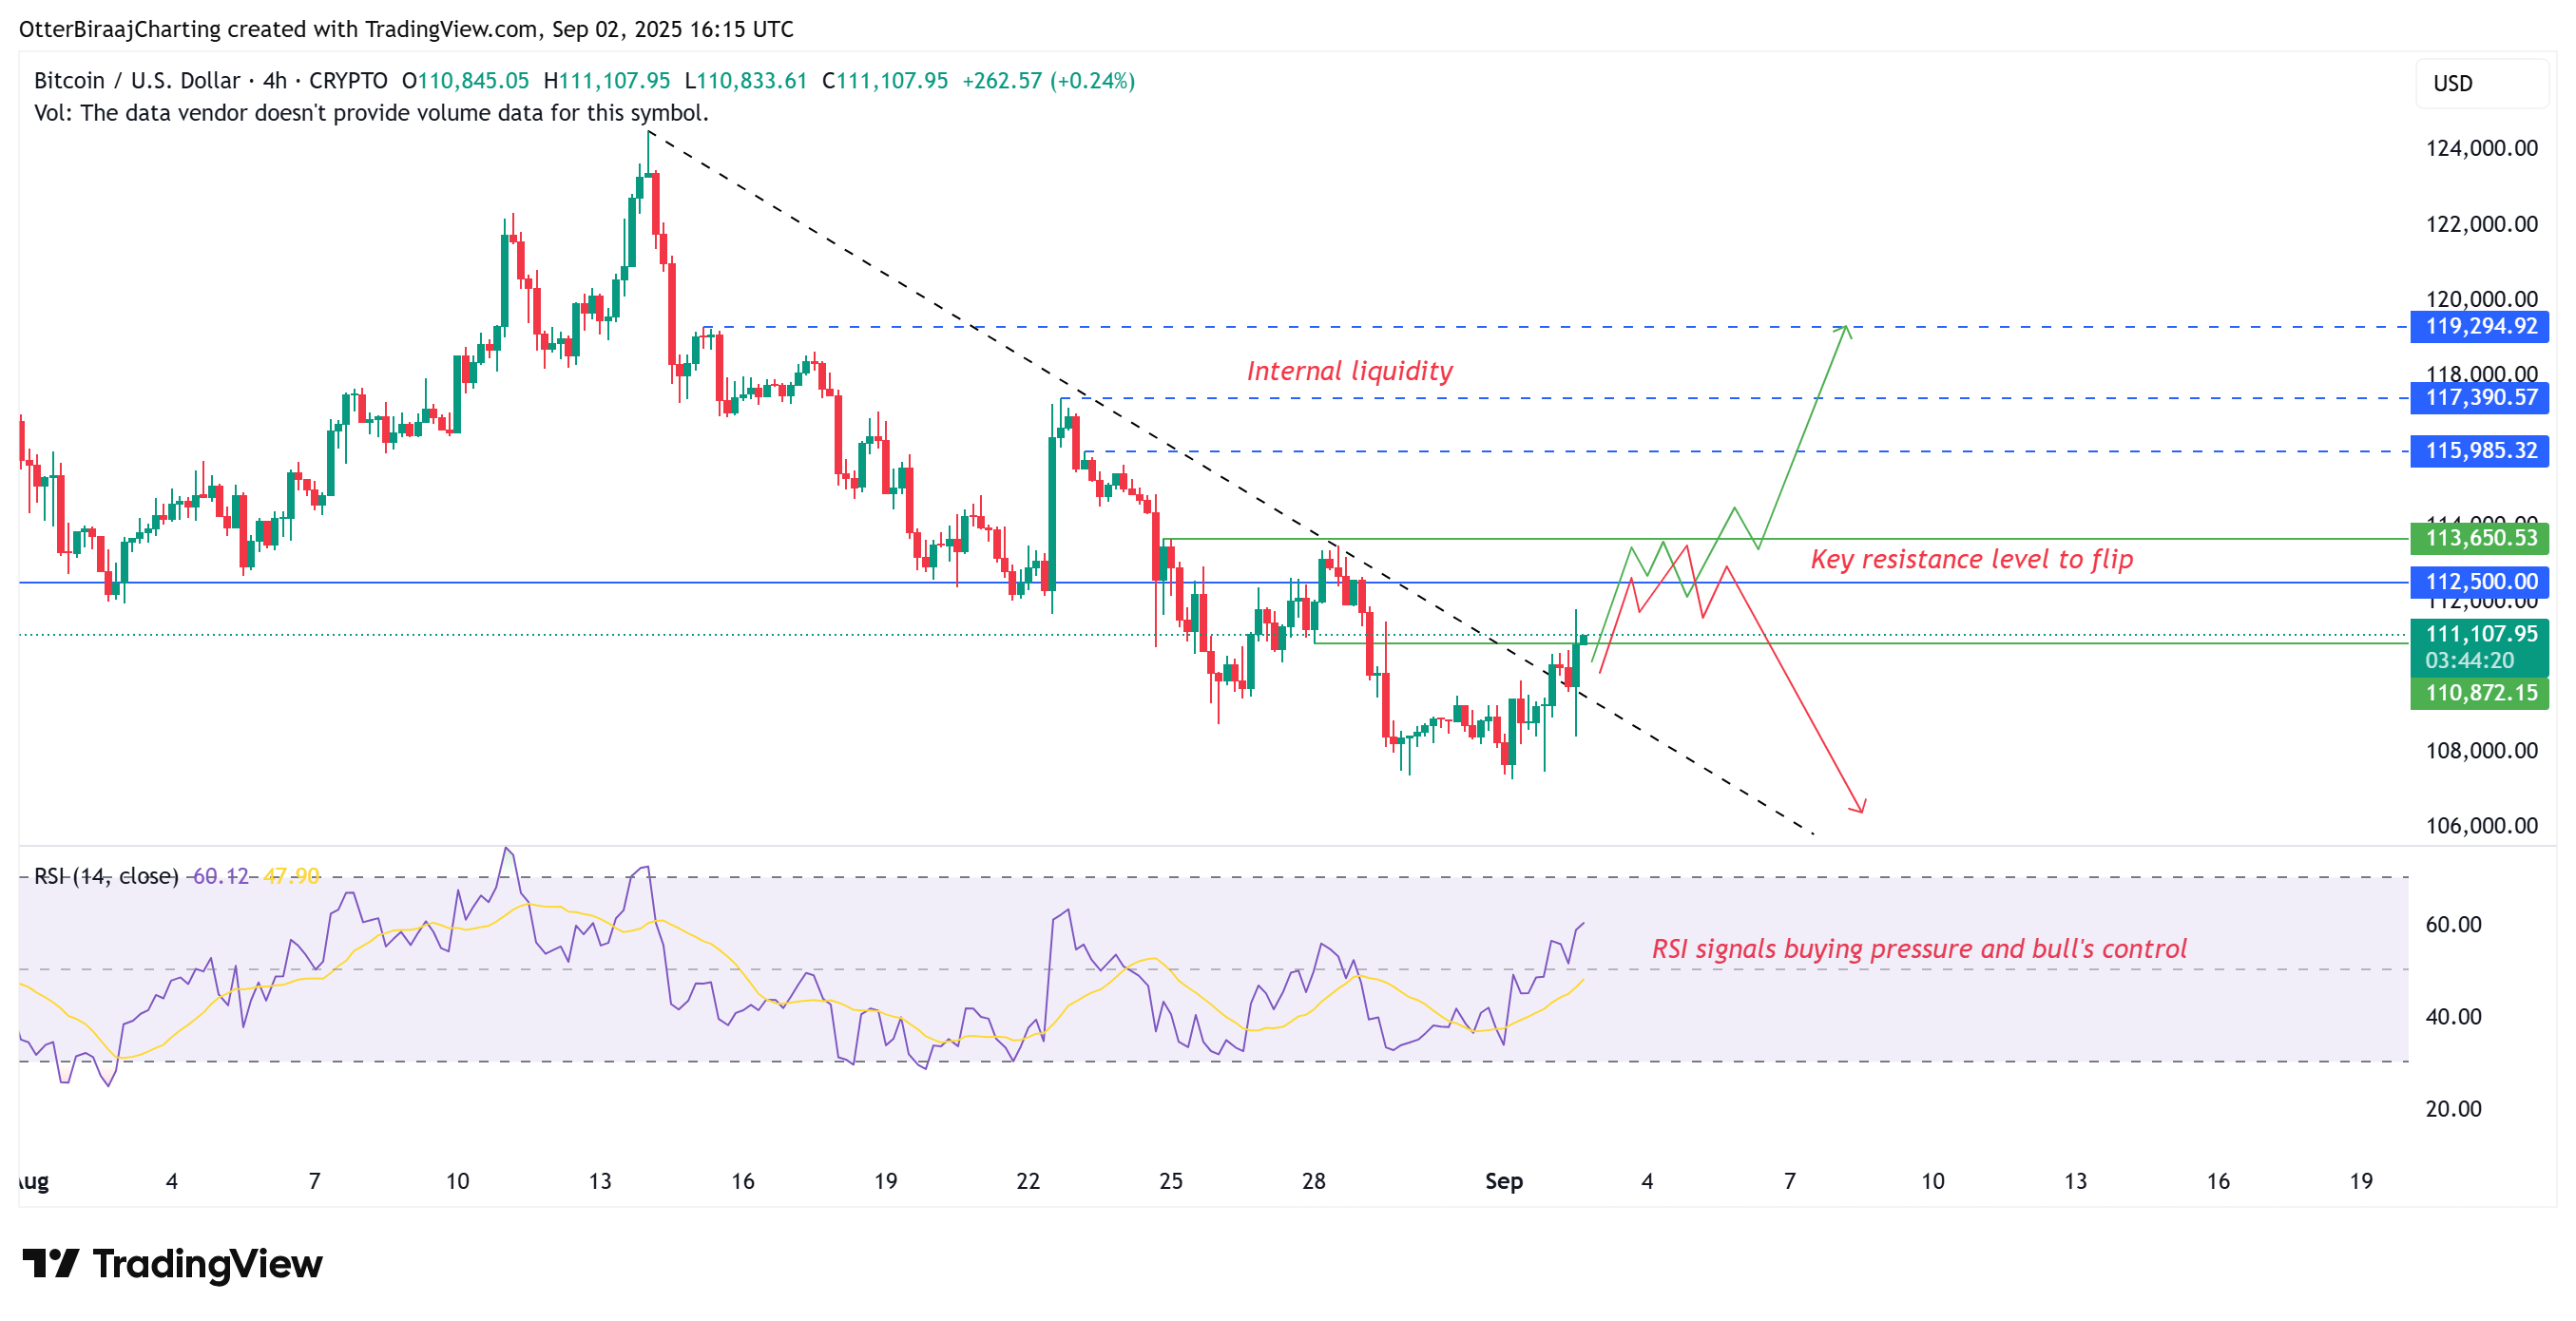
Key Levels and Potential Breakout
Despite the positive signals, there are critical levels to watch. Bitcoin found support near $107,300 this week. However, the market must now break through immediate resistance levels of $112,500 to $113,650. A decisive close above $113,650 would confirm a bullish breakout on the daily chart, invalidating the recent descending trendline. This breakout could open the door towards liquidity targets at $116,300, $117,500, and potentially $119,500. However, traders should remain cautious, especially given the historical bearish trends often observed in September.
If the breakout fails, or if Bitcoin fails to maintain above $113,650, downside targets could include the order block between $105,000 and $100,000. Investors and traders should conduct thorough research and remain vigilant to successfully navigate the complex Bitcoin market.