

Ethereum‘s Tightrope Walk: Bullish Momentum vs. Bearish Pressure
Ethereum (ETH), the second-largest cryptocurrency by market capitalization, is currently navigating a crucial juncture. Its price has been locked within a defined trading range, oscillating between key support and resistance levels. This consolidation phase, however, may be nearing its end, with significant forces pulling ETH in opposing directions.
The Bullish Catalyst: Spot ETF Inflows
A primary driver of potential bullish sentiment stems from the burgeoning inflows into spot Ethereum exchange-traded funds (ETFs). Data indicates a consistent influx of ETH into these investment vehicles, suggesting growing institutional interest and demand. Glassnode’s recent figures highlight a substantial inflow of 106,000 ETH during the past week, marking the seventh consecutive week of positive flows. This influx of capital can be interpreted as a vote of confidence in ETH‘s long-term prospects and a potential catalyst for price appreciation.
The Bearish Counterpoint: Large Withdrawals Emerge
Despite the bullish narrative presented by ETF inflows, a contrasting trend warrants attention. On-chain data reveals substantial Ethereum withdrawals from staking pools. Specifically, two wallets unstaked and withdrew approximately 95,920 ETH earlier this month. A significant portion of this, around 62,289 ETH, has subsequently been deposited on various cryptocurrency exchanges, raising concerns about potential sell-off pressure. This activity could indicate a bearish sentiment among some large ETH holders, who may be looking to take profits or hedge their positions.
Technical Outlook: Key Levels to Watch
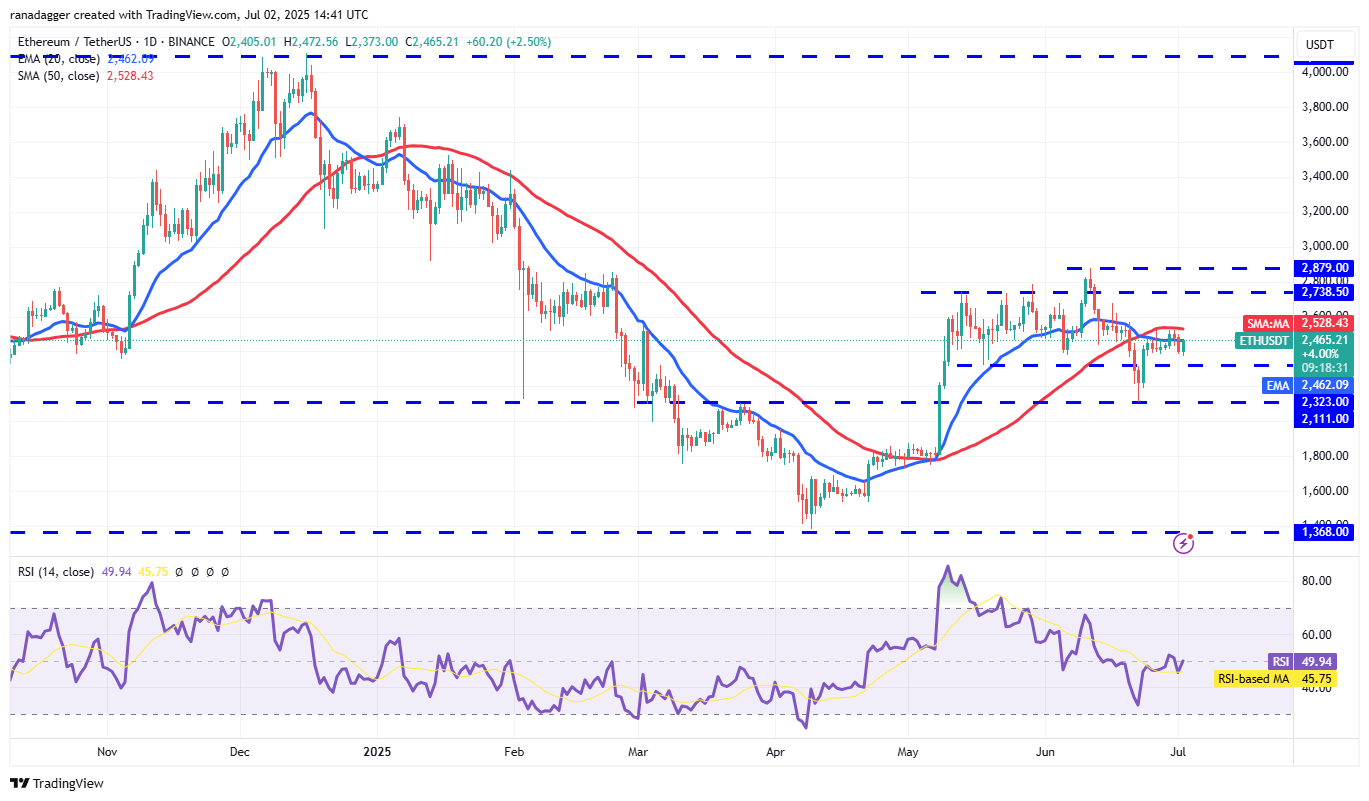
From a technical perspective, ETH‘s price action has been confined between the 50-day simple moving average (SMA) and the horizontal support level. The relative strength index (RSI) hovers near the midpoint, indicating a period of consolidation. A decisive breakout above the 50-day SMA, currently around $2,528, could propel ETH towards higher targets, potentially reaching $2,738 and then $2,879. Conversely, a rejection at the 50-day SMA could expose the $2,323 support level. A breach below this could trigger a further decline, with $2,111 being the next significant support zone.
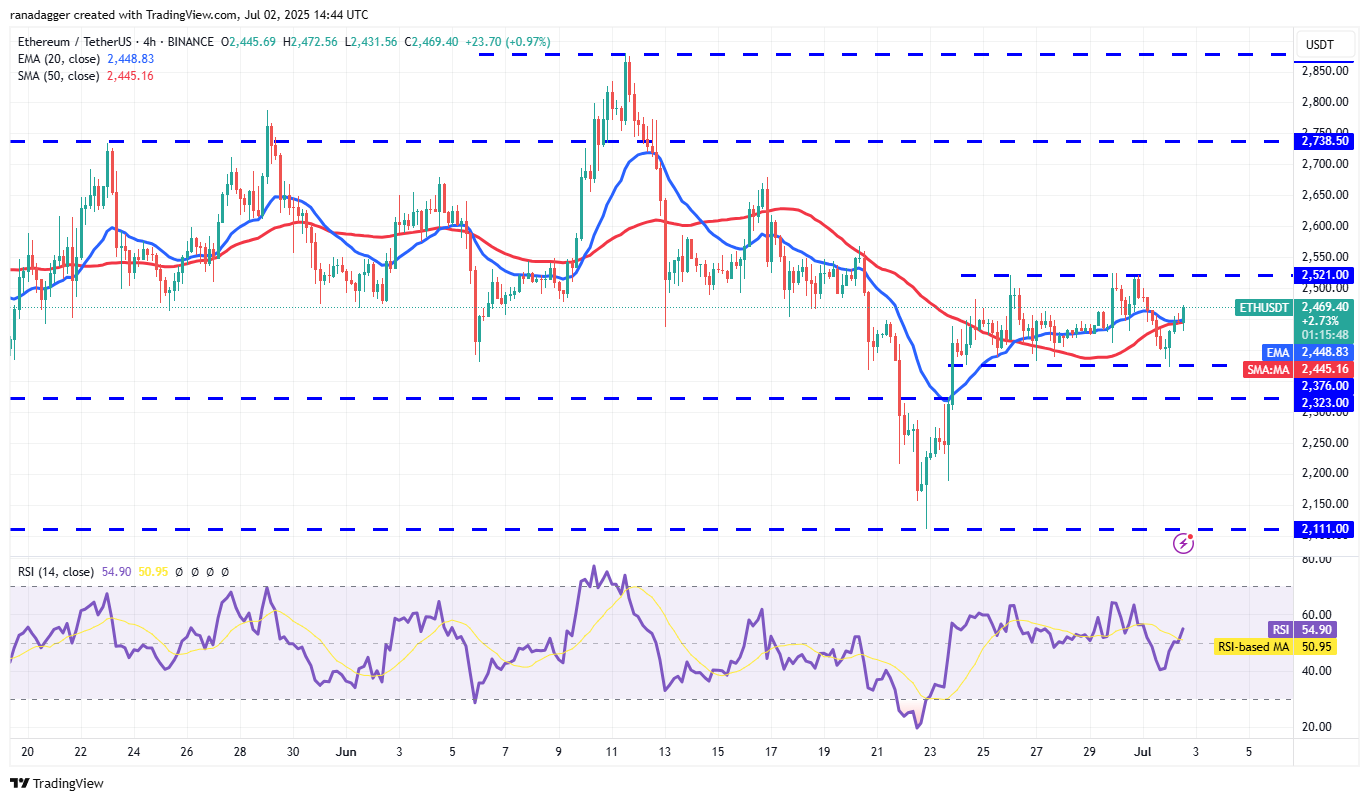
The 4-hour chart depicts a similar range-bound scenario, with resistance and support levels identified. Flattening moving averages and an RSI hovering near the midpoint suggest a continued period of consolidation. Sustained trading above the moving averages could pave the way to $2,521, while failure to hold support could result in extended range-bound price action.
The Verdict: Awaiting the Resolution
Ultimately, the future direction of Ethereum‘s price hinges on the battle between these conflicting forces. Will the bullish momentum from ETF inflows outweigh the potential selling pressure from large withdrawals? Or will the bears succeed in pushing ETH below its key support levels? Crypto investors and traders should closely monitor the charts, key support and resistance levels, and on-chain data to make informed decisions. The coming days promise to be pivotal in determining the next significant trend for ETH.