

Ethereum‘s Bullish Outlook: A 75% Surge Against Bitcoin?
The cryptocurrency market is abuzz with speculation, and a recent analysis suggests a potentially dramatic shift in the ETH/BTC landscape. Projections indicate that Ethereum‘s native token, Ether (ETH), could experience a remarkable 75% surge against Bitcoin (BTC) by the close of the year. This optimistic forecast stems from a confluence of technical indicators, primarily centered around a maturing bullish reversal pattern on the weekly chart.
Inverse Head and Shoulders: A Key Indicator
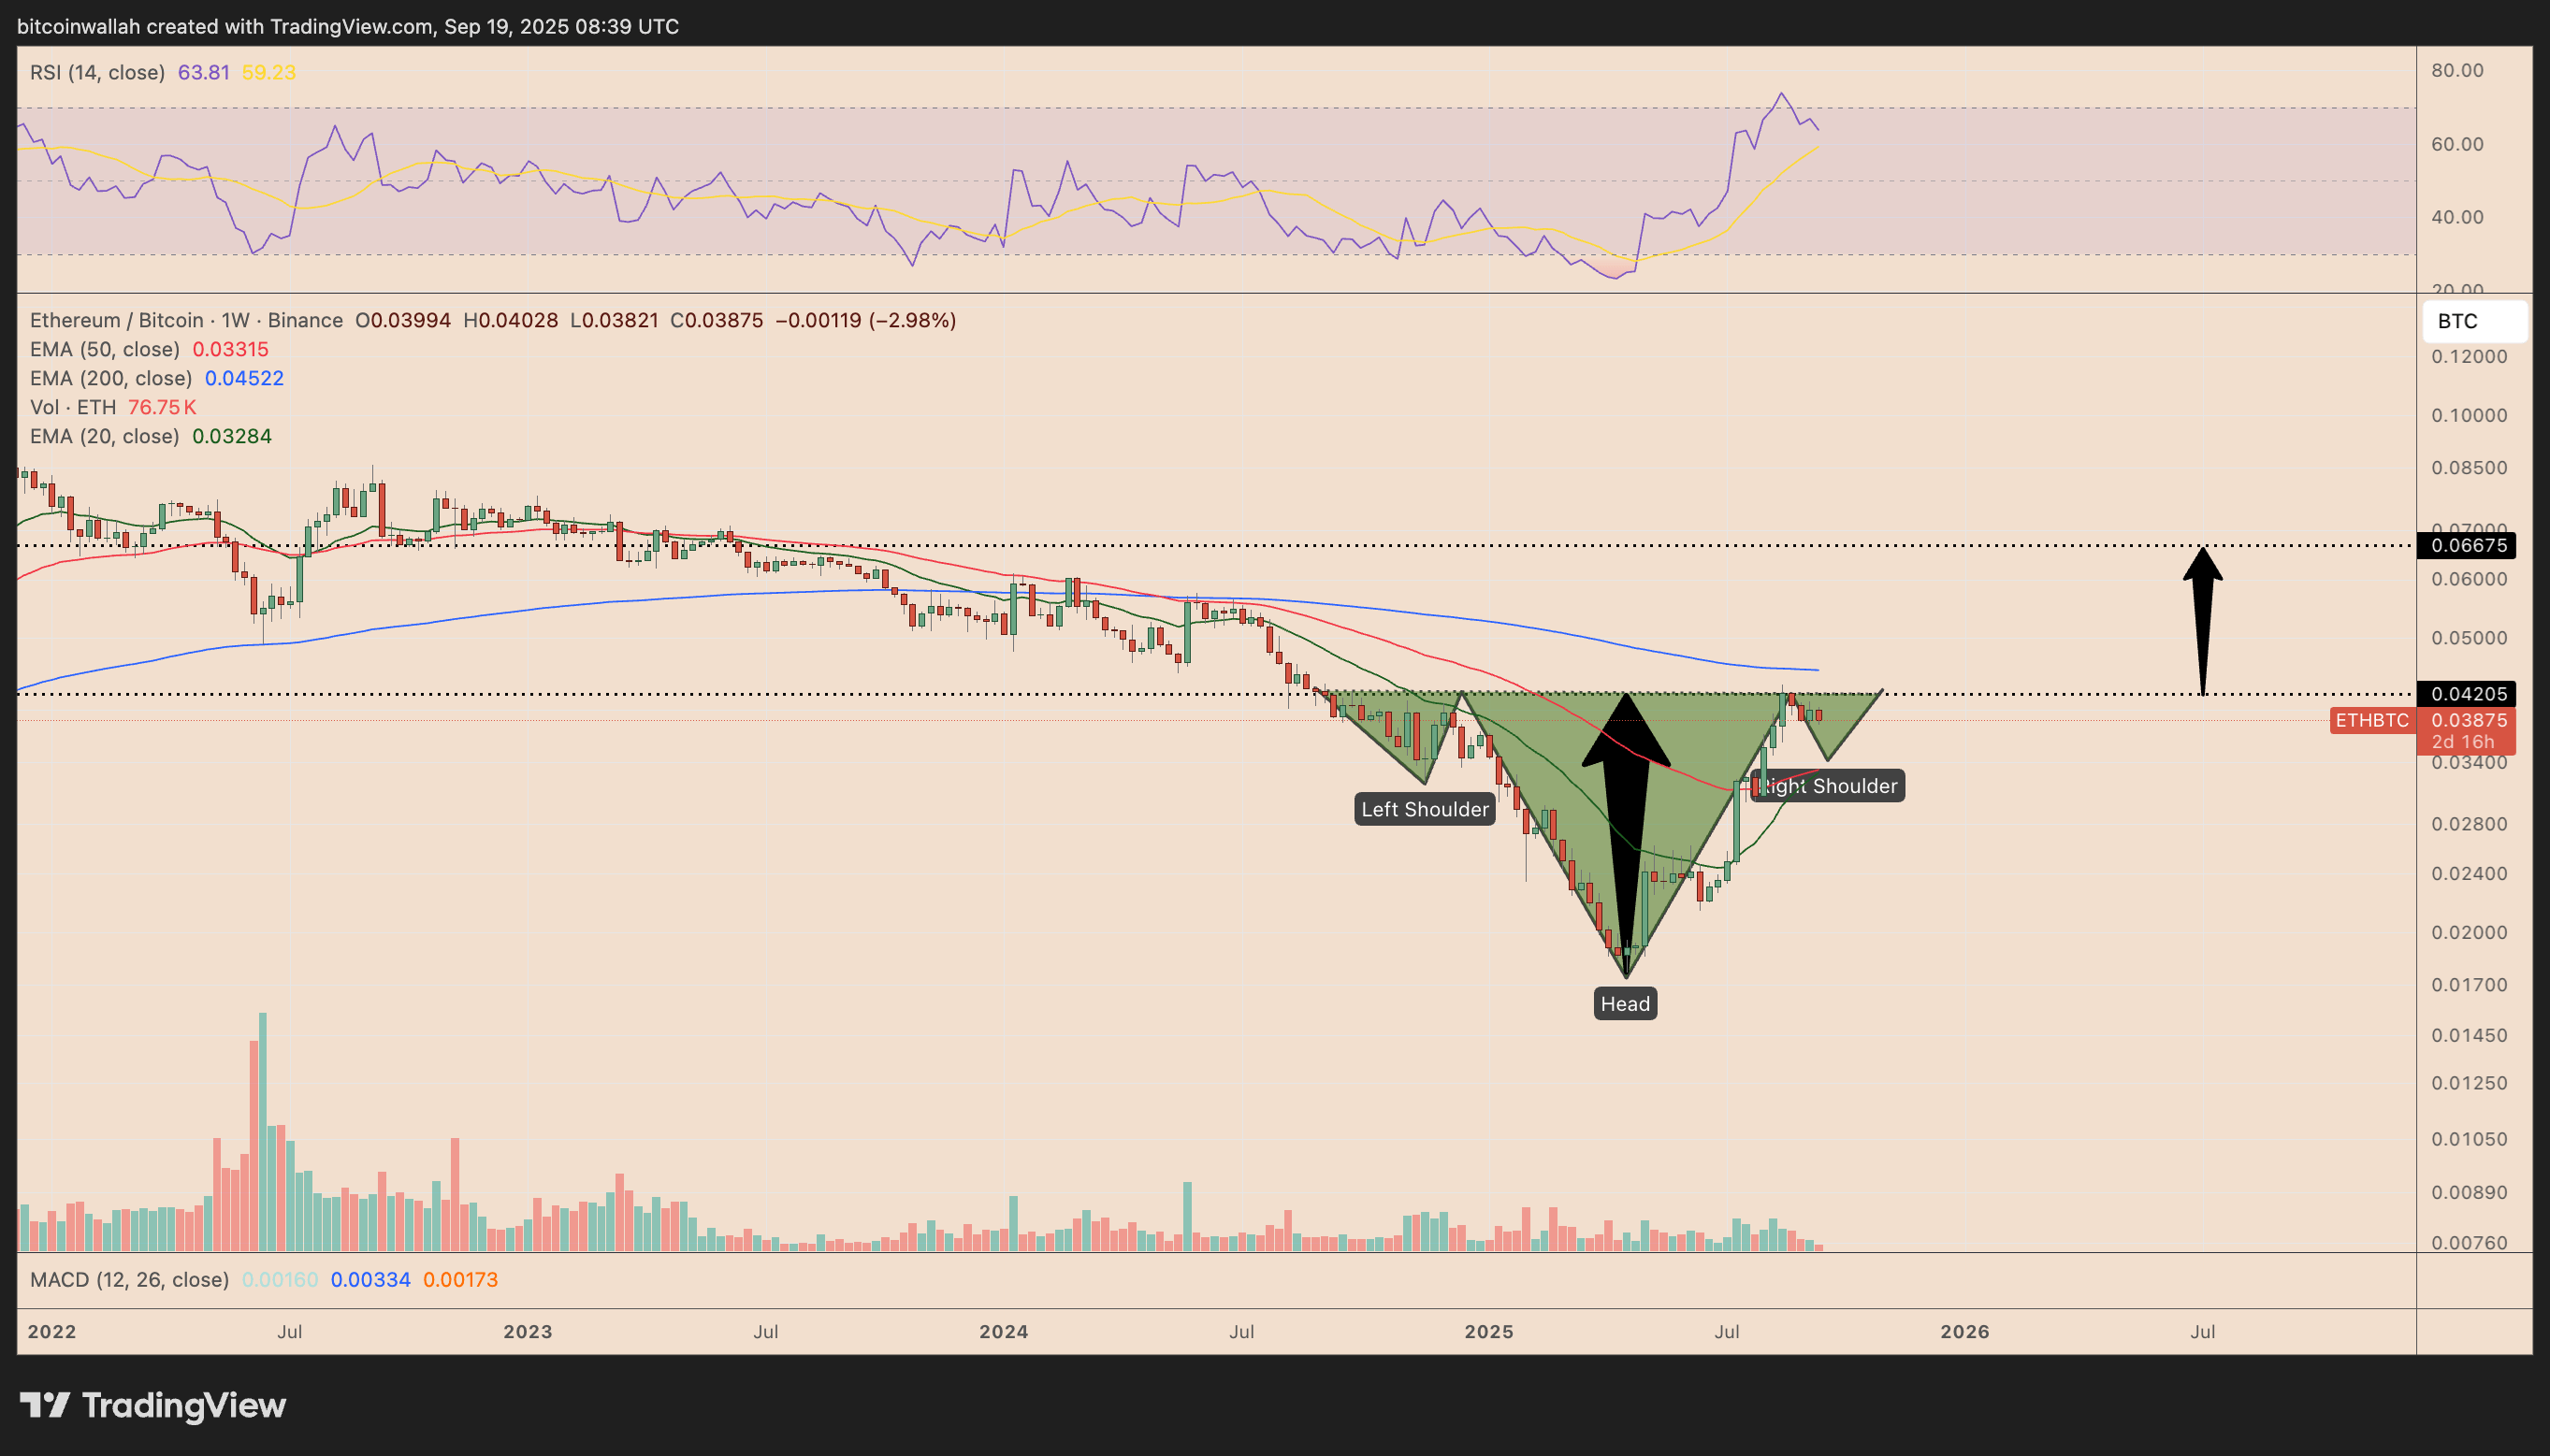
The cornerstone of this bullish prediction is the formation of an inverse head-and-shoulders (IH&S) pattern on the ETH/BTC weekly chart. This pattern, characterized by three troughs with a common neckline resistance, typically signals a trend reversal. The analysts point to a neckline around 0.0420 BTC. The IH&S pattern’s implications are significant: a breakout above the neckline often leads to a price increase equivalent to the pattern’s maximum height. Based on this technical rule, the upside target for the ETH/BTC pair by year-end is estimated to be around 0.066 BTC, representing the aforementioned 75% increase from current rates.
Golden Cross and Further Bullish Signals
Further bolstering the bullish outlook is the imminent formation of a golden cross between Ethereum‘s 20-week exponential moving average (EMA) and its 50-week EMA. Historical precedent supports this, as a similar crossover in July 2020 preceded a substantial 250% surge in the ETH/BTC rates. The potential for a price dip into the 0.033–0.045 BTC support zone, aligning with the EMAs, could serve as a springboard for a rebound, further confirming the breakout scenario. This potential dip should be observed as a possible buying opportunity for those who believe in the breakout.
Resistance Levels and Potential Roadblocks
Despite the optimistic signals, several key resistance levels stand in the way of a clear breakout. The 200-week EMA, currently positioned near 0.045 BTC, has historically acted as a significant barrier, repeatedly thwarting upward price movements. Moreover, a long-term downward trendline, which has defined Ethereum‘s tops against Bitcoin since 2017, presents a formidable challenge, currently residing in the 0.050–0.055 BTC zone. Overcoming these hurdles is crucial for validating the projected surge. Should ETH/BTC close above the 200-week EMA, a run at this trendline is likely.
Risks and Considerations
It is critical to remember that the cryptocurrency market is inherently volatile. While the technical indicators paint a compelling picture, external factors and unforeseen market events can significantly impact price movements. The analysis also suggests a 15-30% growth potential for Ether versus Bitcoin this year, so even if the 75% gain isn’t reached, there’s still reason for optimism. Investors should approach these projections with caution, conduct thorough research, and consider their risk tolerance before making any investment decisions. The future of ETH/BTC will depend not only on market trends but also on the wider adoption and development of the Ethereum network and its ability to maintain its competitive edge in the rapidly evolving crypto ecosystem.