

Ethereum‘s Record-Breaking Inflow: A Bullish Signal or a Bear Trap?
The Ethereum (ETH) network saw an unprecedented influx of 449,000 ETH on April 22, flowing into accumulation addresses. This record-breaking single-day inflow, valued at an average price of $1,750, has sparked debate among analysts about its implications for the future of the second-largest cryptocurrency.
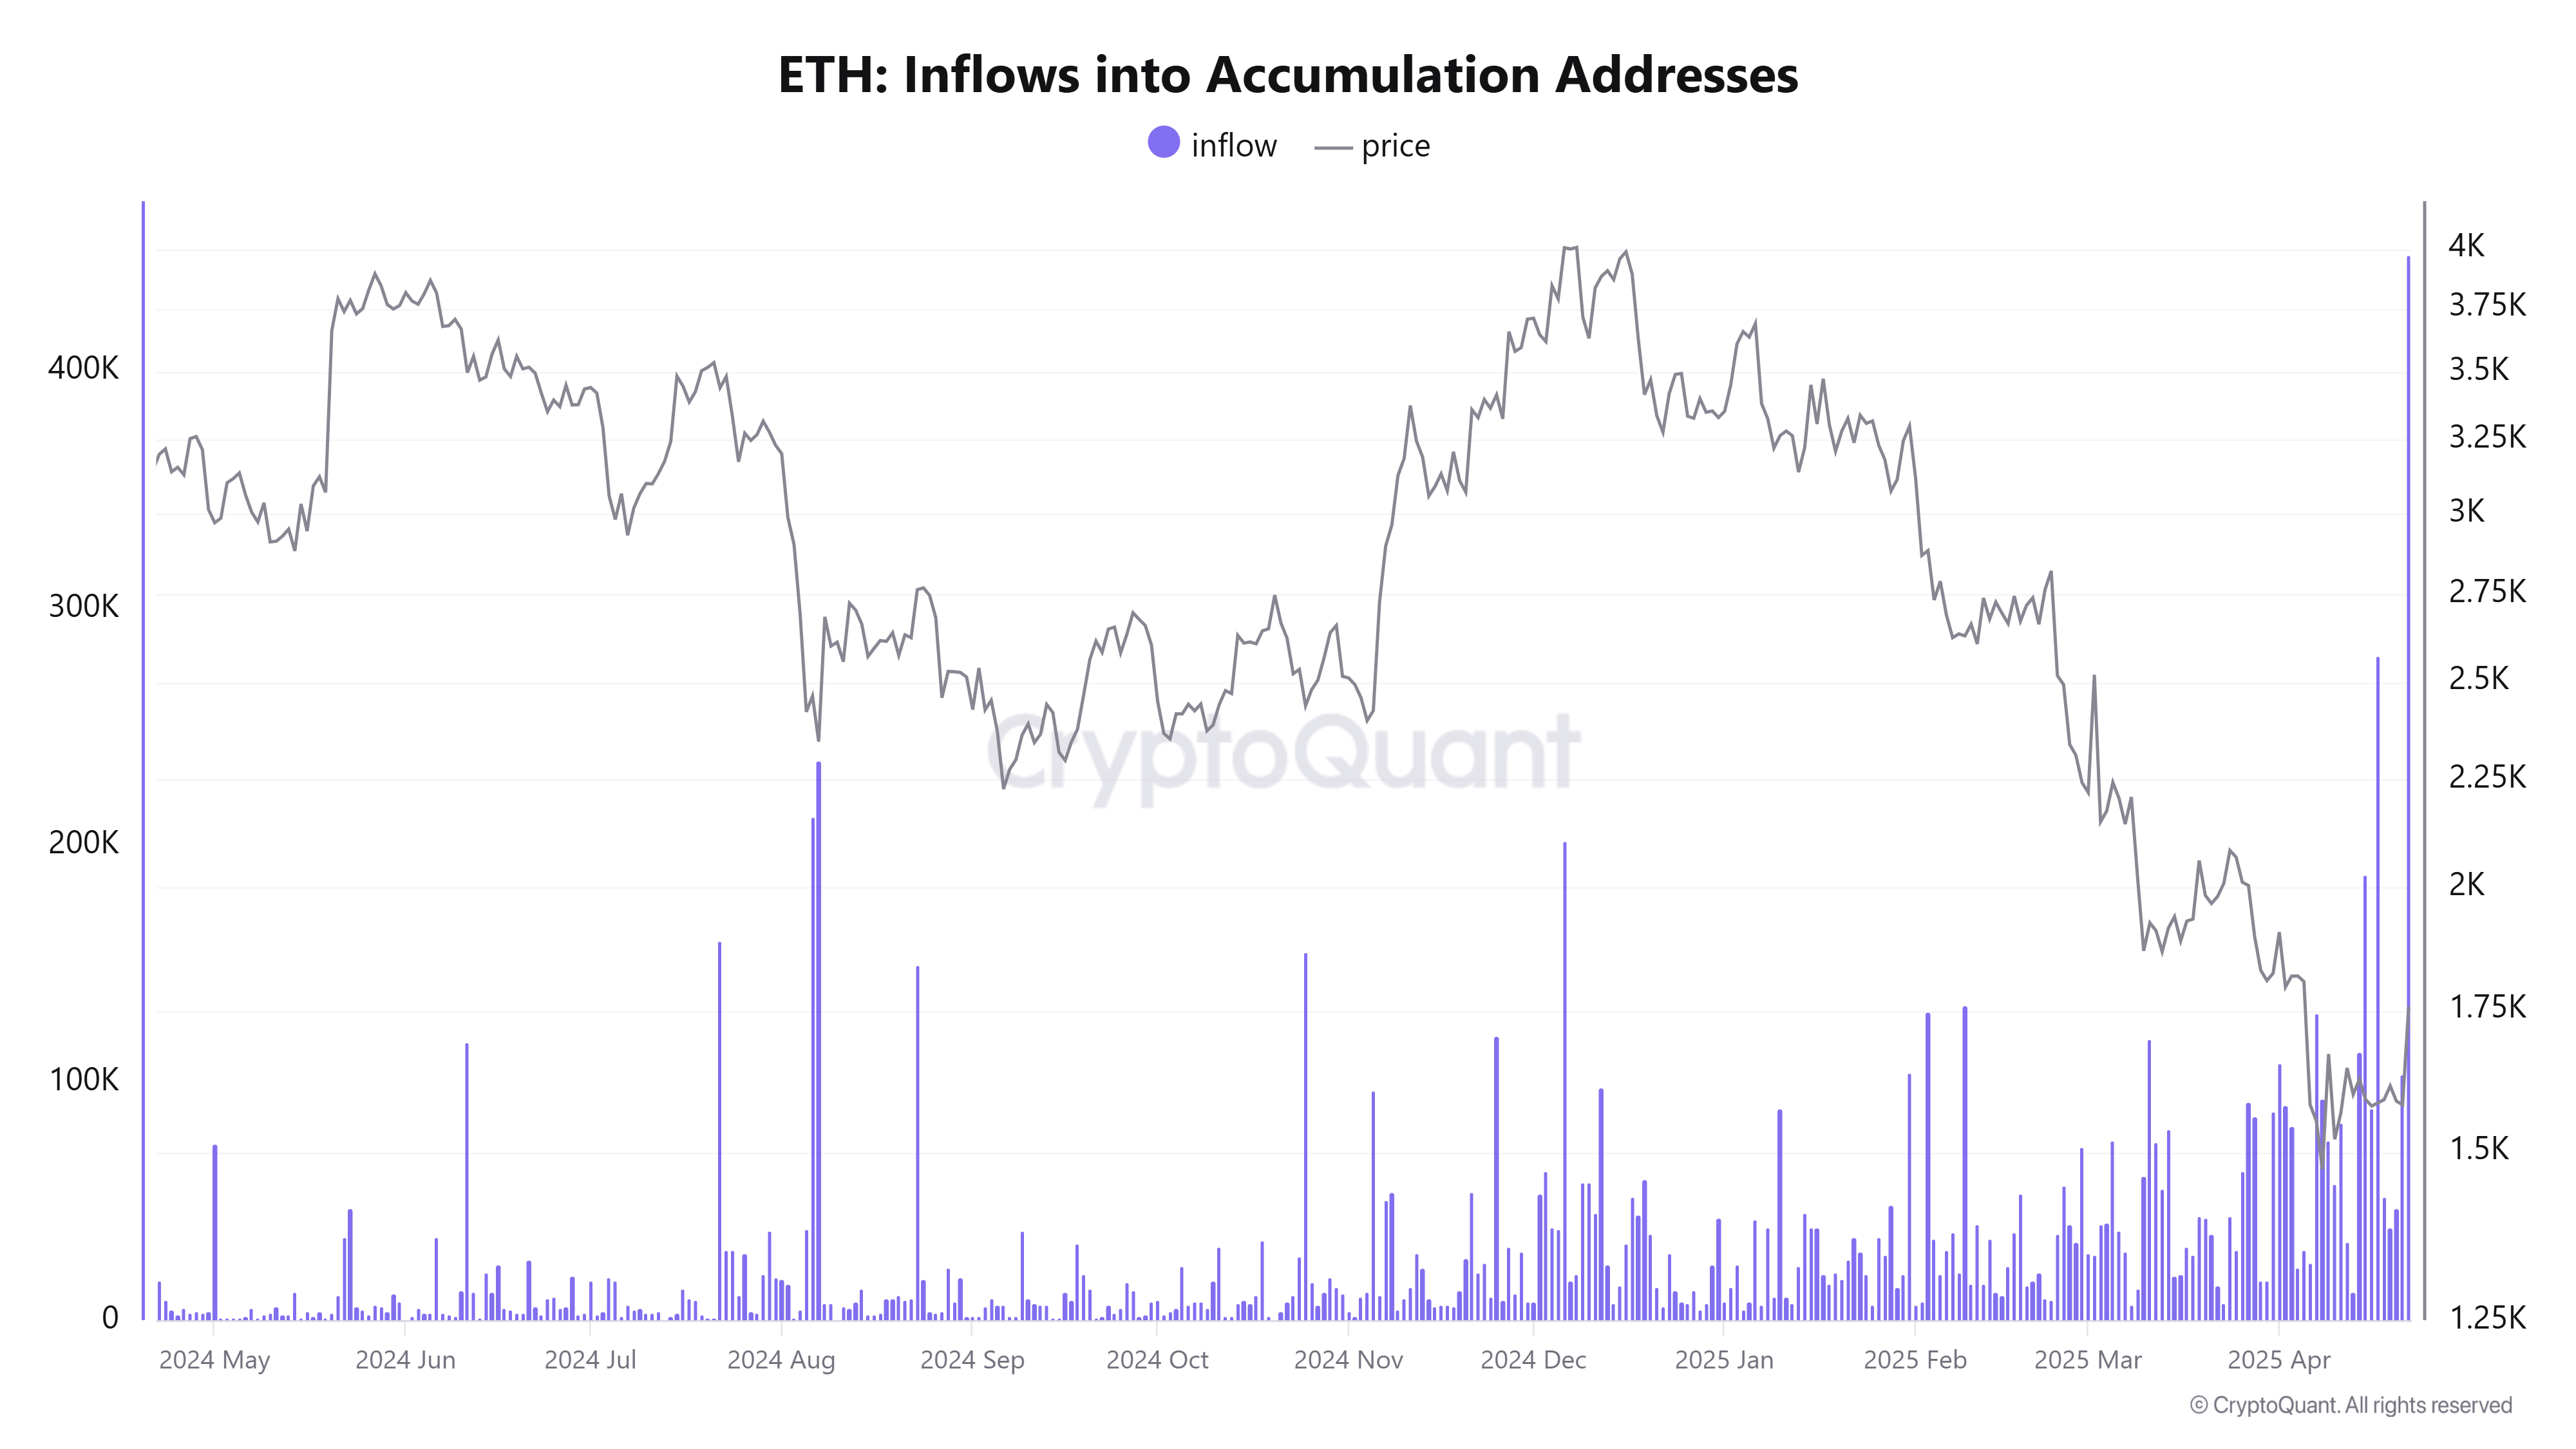
This massive influx suggests that long-term holders, known for their strategic and patient approach, remain optimistic about Ethereum‘s prospects. This optimism is particularly notable given the recent price declines and the prevailing market sentiment.
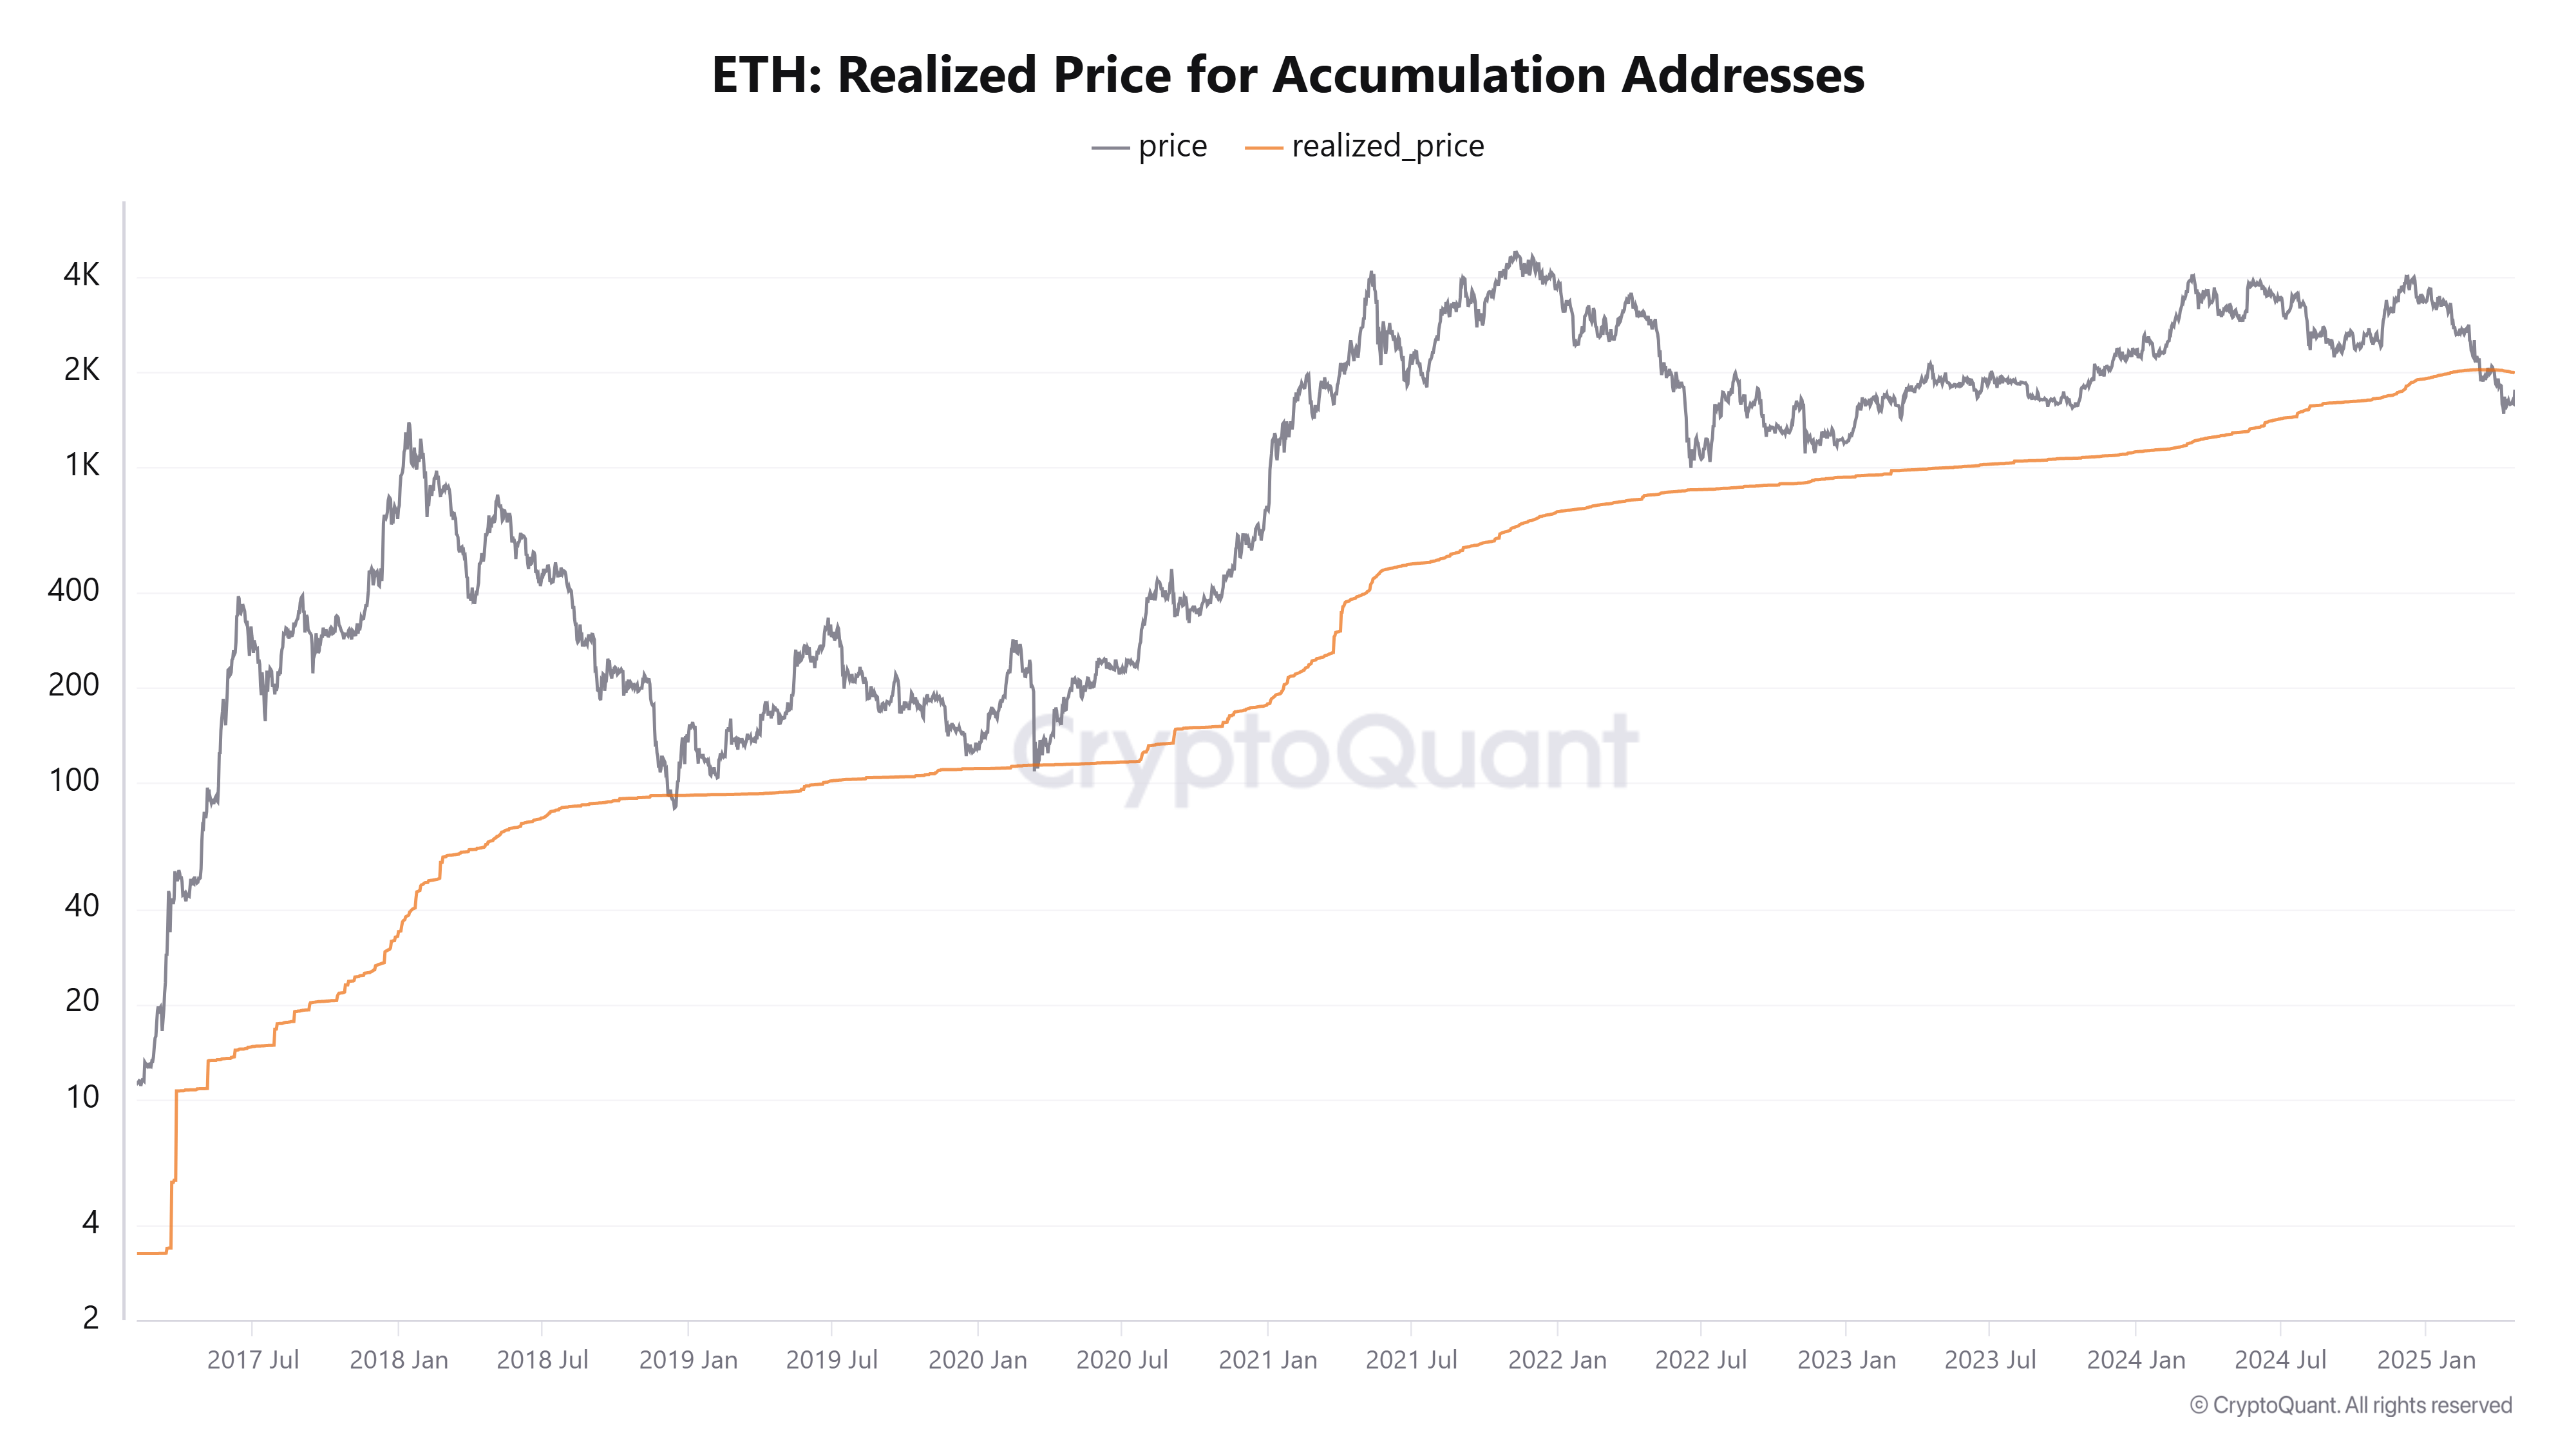
However, a closer look reveals a more nuanced picture. The realized price for these accumulation addresses currently stands at $1,981, indicating that these holders are currently underwater. This means that they are currently experiencing a loss on their investments, as the current market price is below their average purchase price. Notably, the realized price had been below Ethereum‘s market price since 2018, only recently surpassing it, signifying a recent shift in holder dynamics.
Onchain Activity and DeFi Trends
Onchain activity has also shown positive momentum in recent days. The number of active addresses on the Ethereum network rose by 10% between April 20 and 22, reaching 336,366, indicating increasing network engagement and potentially bullish sentiment. This rise is fueled by a recent uptick in Ethereum‘s price, further contributing to the overall positive sentiment.
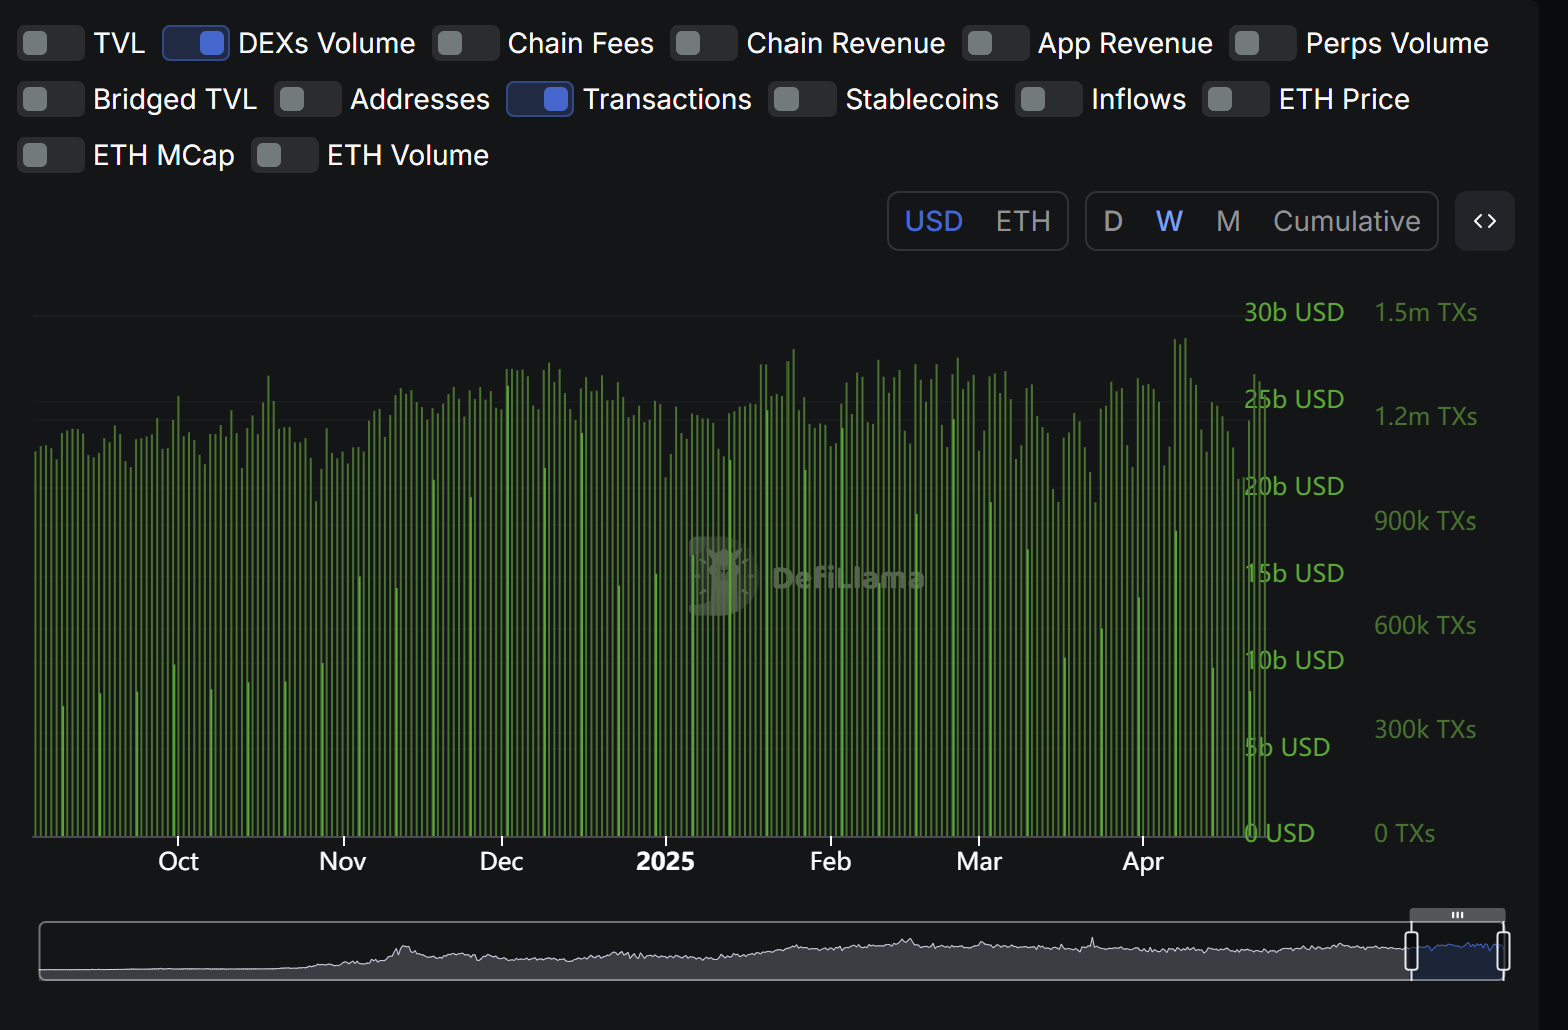
However, the decentralized finance (DeFi) sector continues to struggle. Decentralized exchange (DEX) volumes are declining, with transactions holding steady at a weekly average of approximately 1.3 million. This suggests limited DeFi momentum and indicates that the recent price increase might not be entirely driven by DeFi activity.
Key Resistance Level and Technical Analysis
Ethereum faces a crucial resistance level at $1,895. This level is marked by a concentration of 1.64 million ETH held by investors who bought during November 2024. If the price approaches this level, selling pressure could emerge as these holders attempt to break even or lock in profits. The price currently hovering near the daily chart’s 50-day exponential moving average (EMA) further strengthens this resistance, which could lead to further bearish momentum if not broken.
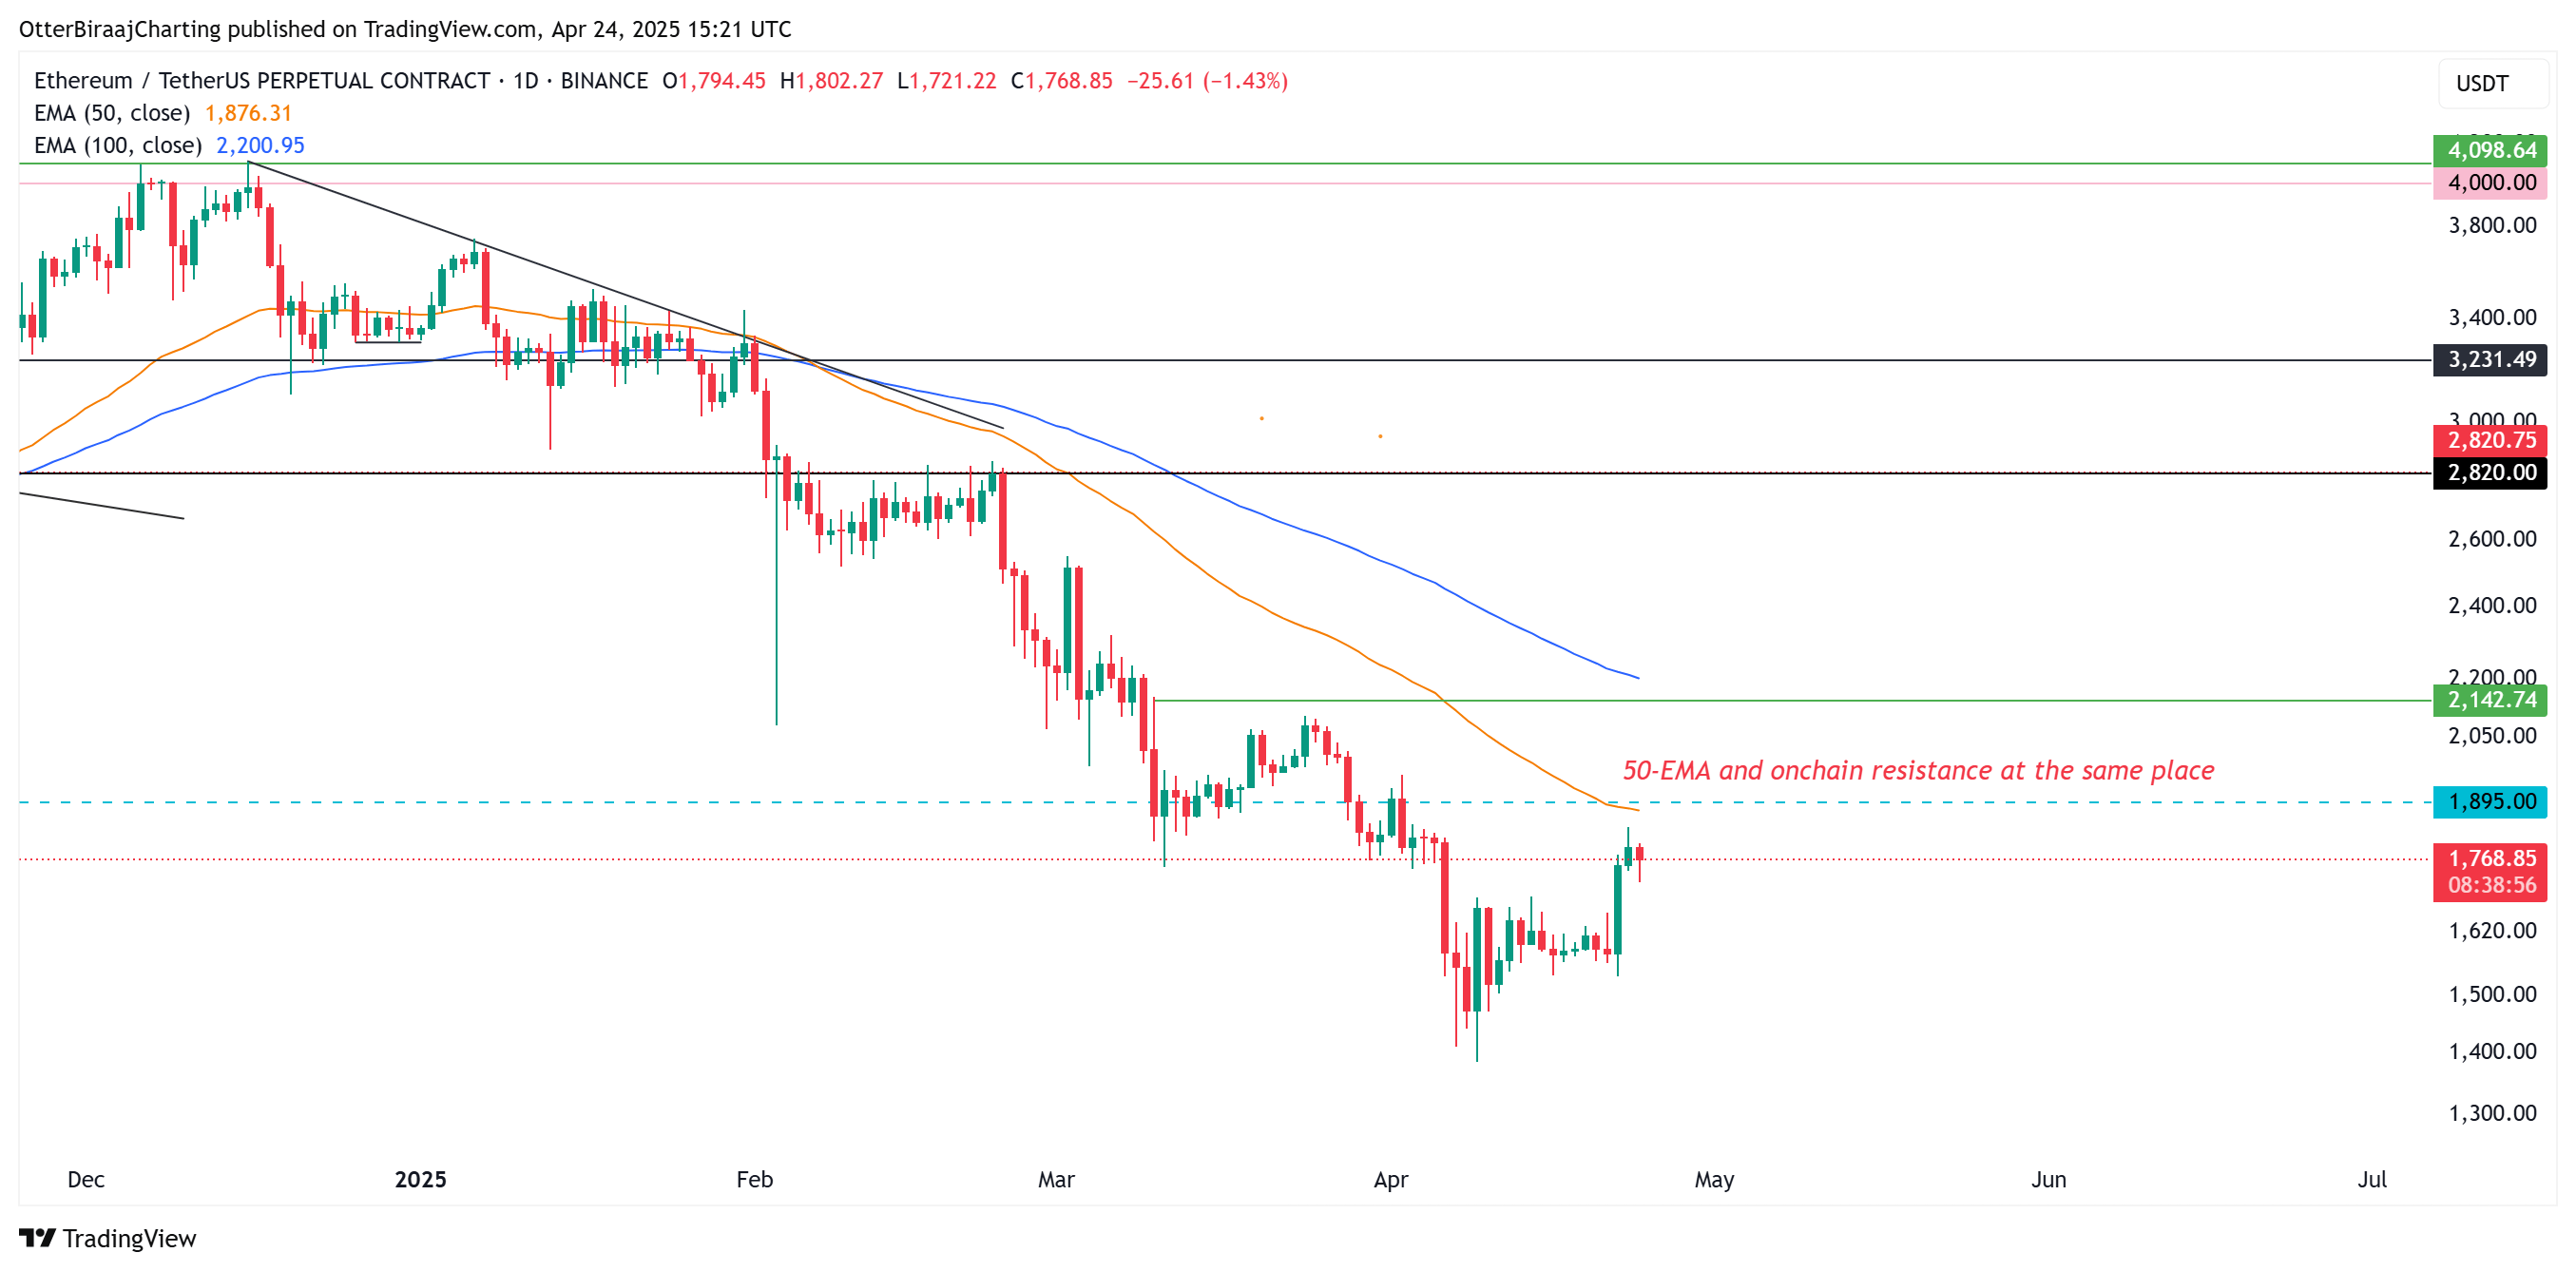
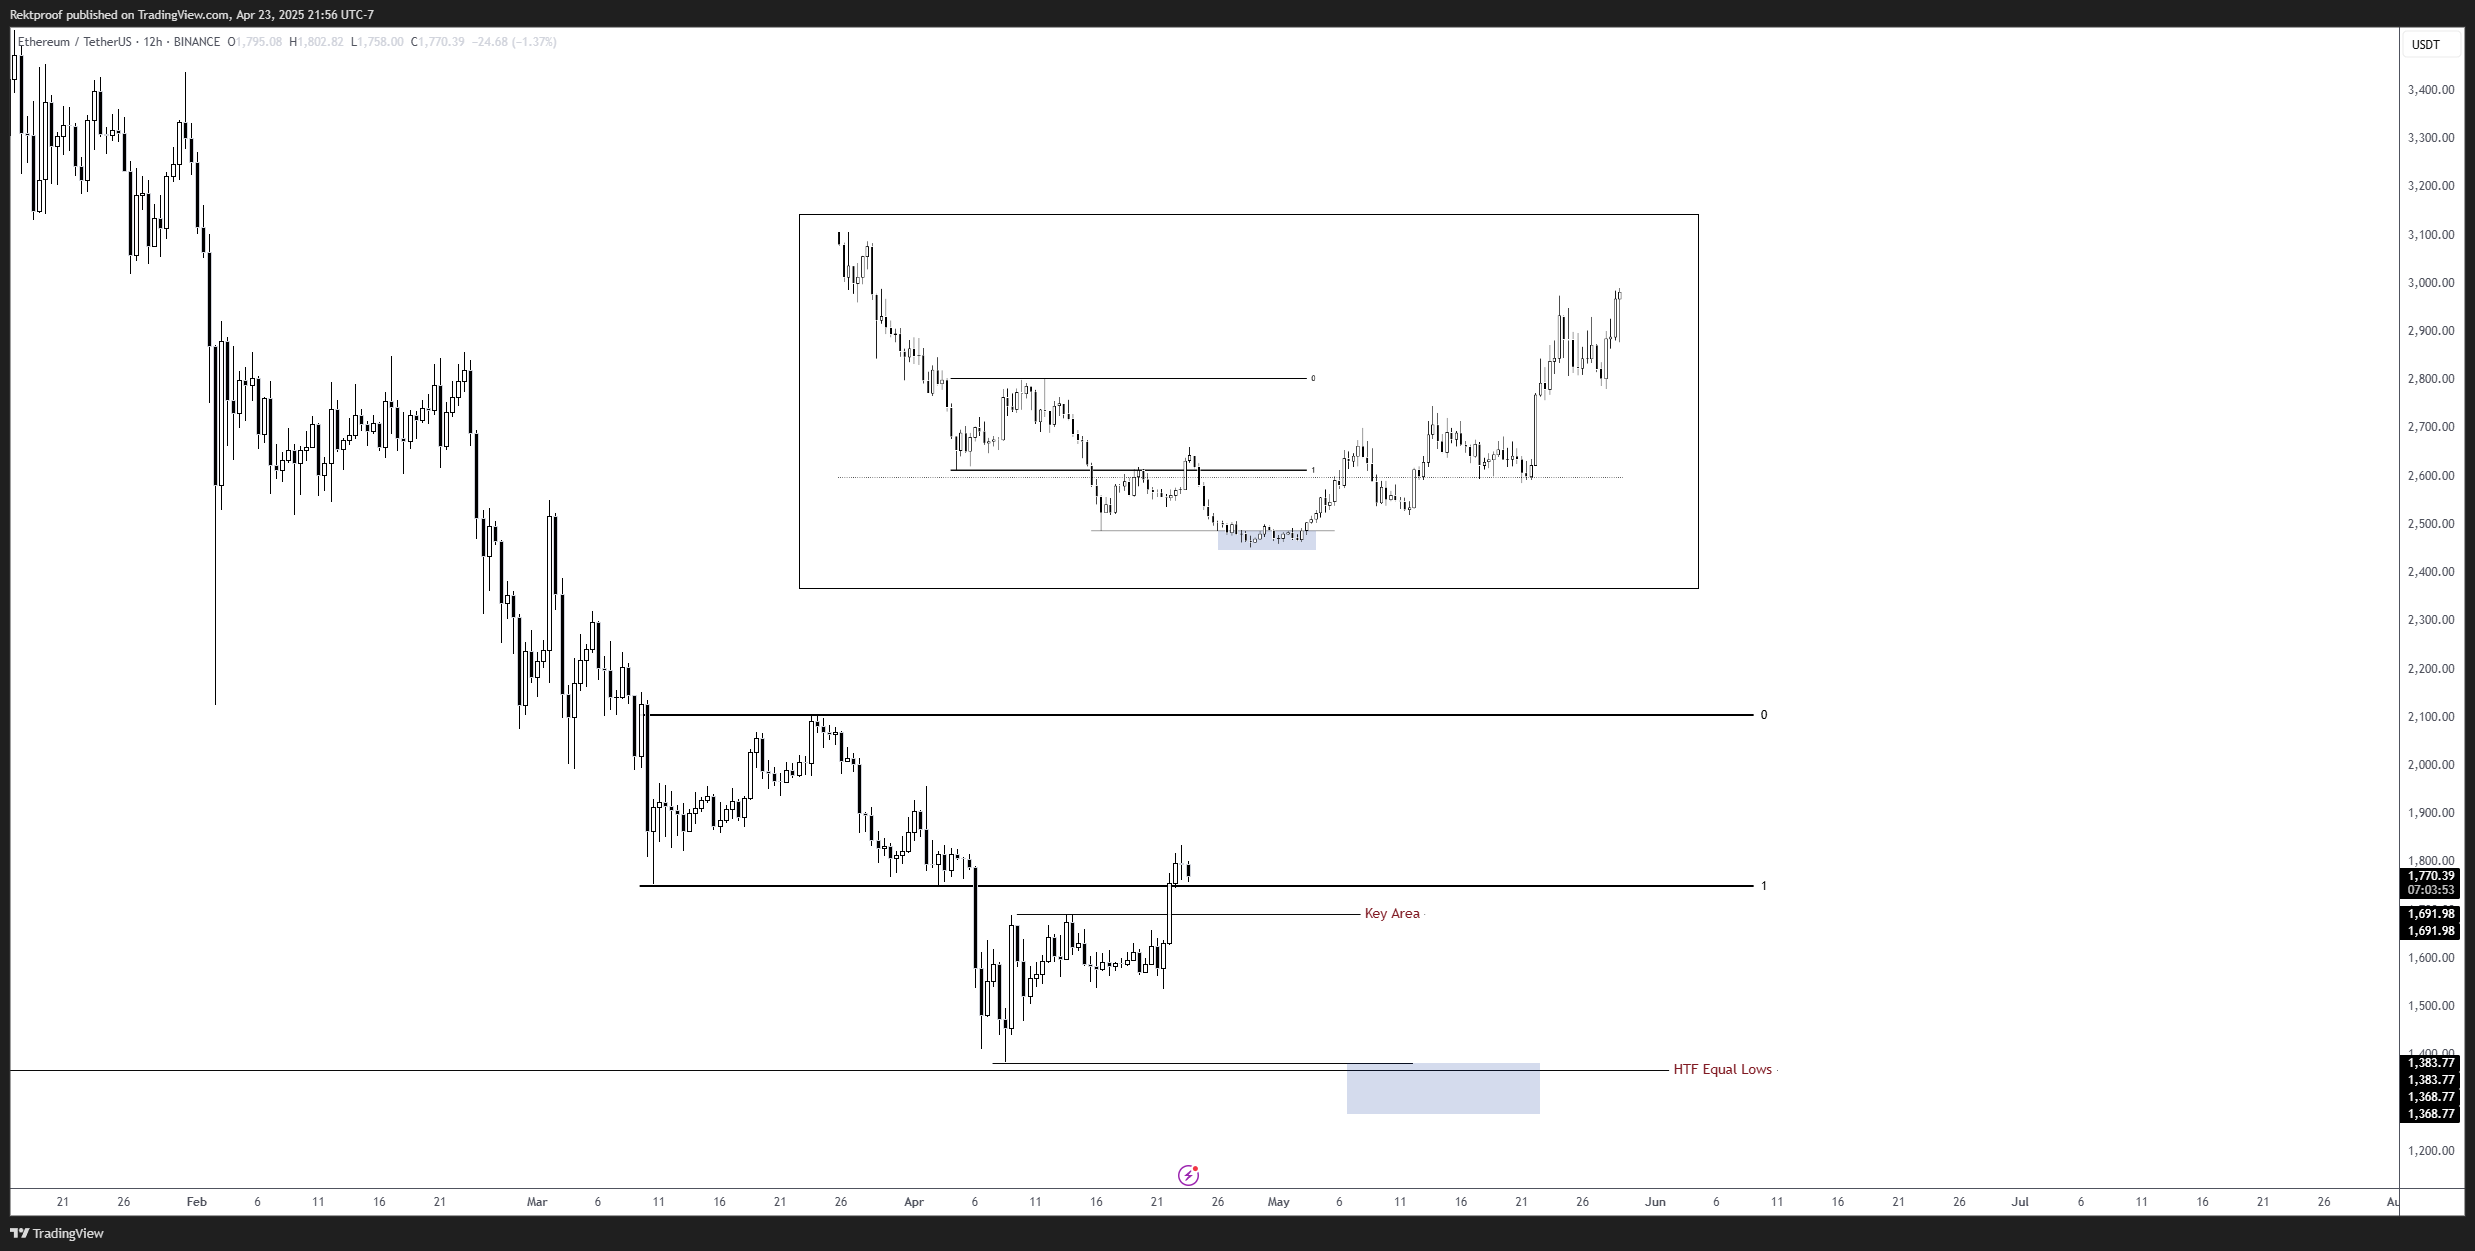
Despite the positive onchain activity, Ethereum remains in a clear downtrend on higher time frame charts. A daily close above $2,142 is crucial to spark a potential recovery and break the pattern of lower highs and lower lows. However, anonymous trader Rektproof warns of an emerging bearish fractal, a repeating price pattern that historically led to declines. This suggests Ethereum could face another rejection and drop below $1,400 if the market trends down again.
Navigating Uncertainty: A Cautious Outlook
The record inflow of ETH into accumulation addresses is a positive sign, suggesting that long-term holders remain optimistic. However, it’s important to remember that these holders are currently underwater and might face selling pressure if the market sentiment turns bearish. While the onchain activity has shown some positive signs, the decline in DeFi activity raises questions about the sustainability of the current price rally.
The potential resistance level at $1,895 and the emerging bearish fractal highlighted by Rektproof add further uncertainty to the market outlook. While the record-breaking inflow provides a glimmer of hope for a potential rebound, investors should remain cautious and monitor the market closely to navigate this volatile period.