

Ethereum‘s Potential Surge Against Bitcoin: A 2026 Outlook
The cryptocurrency market is abuzz with speculation, and recent technical analysis suggests a potentially significant shift in the Ethereum (ETH) versus Bitcoin (BTC) landscape. Analysts are pointing to the possibility of ETH experiencing an 80% rally against BTC by 2026, based on emerging chart patterns. This projection has captured the attention of investors and traders alike, sparking discussions about the future performance of these two leading cryptocurrencies.
Inverse Head and Shoulders: A Bullish Signal?
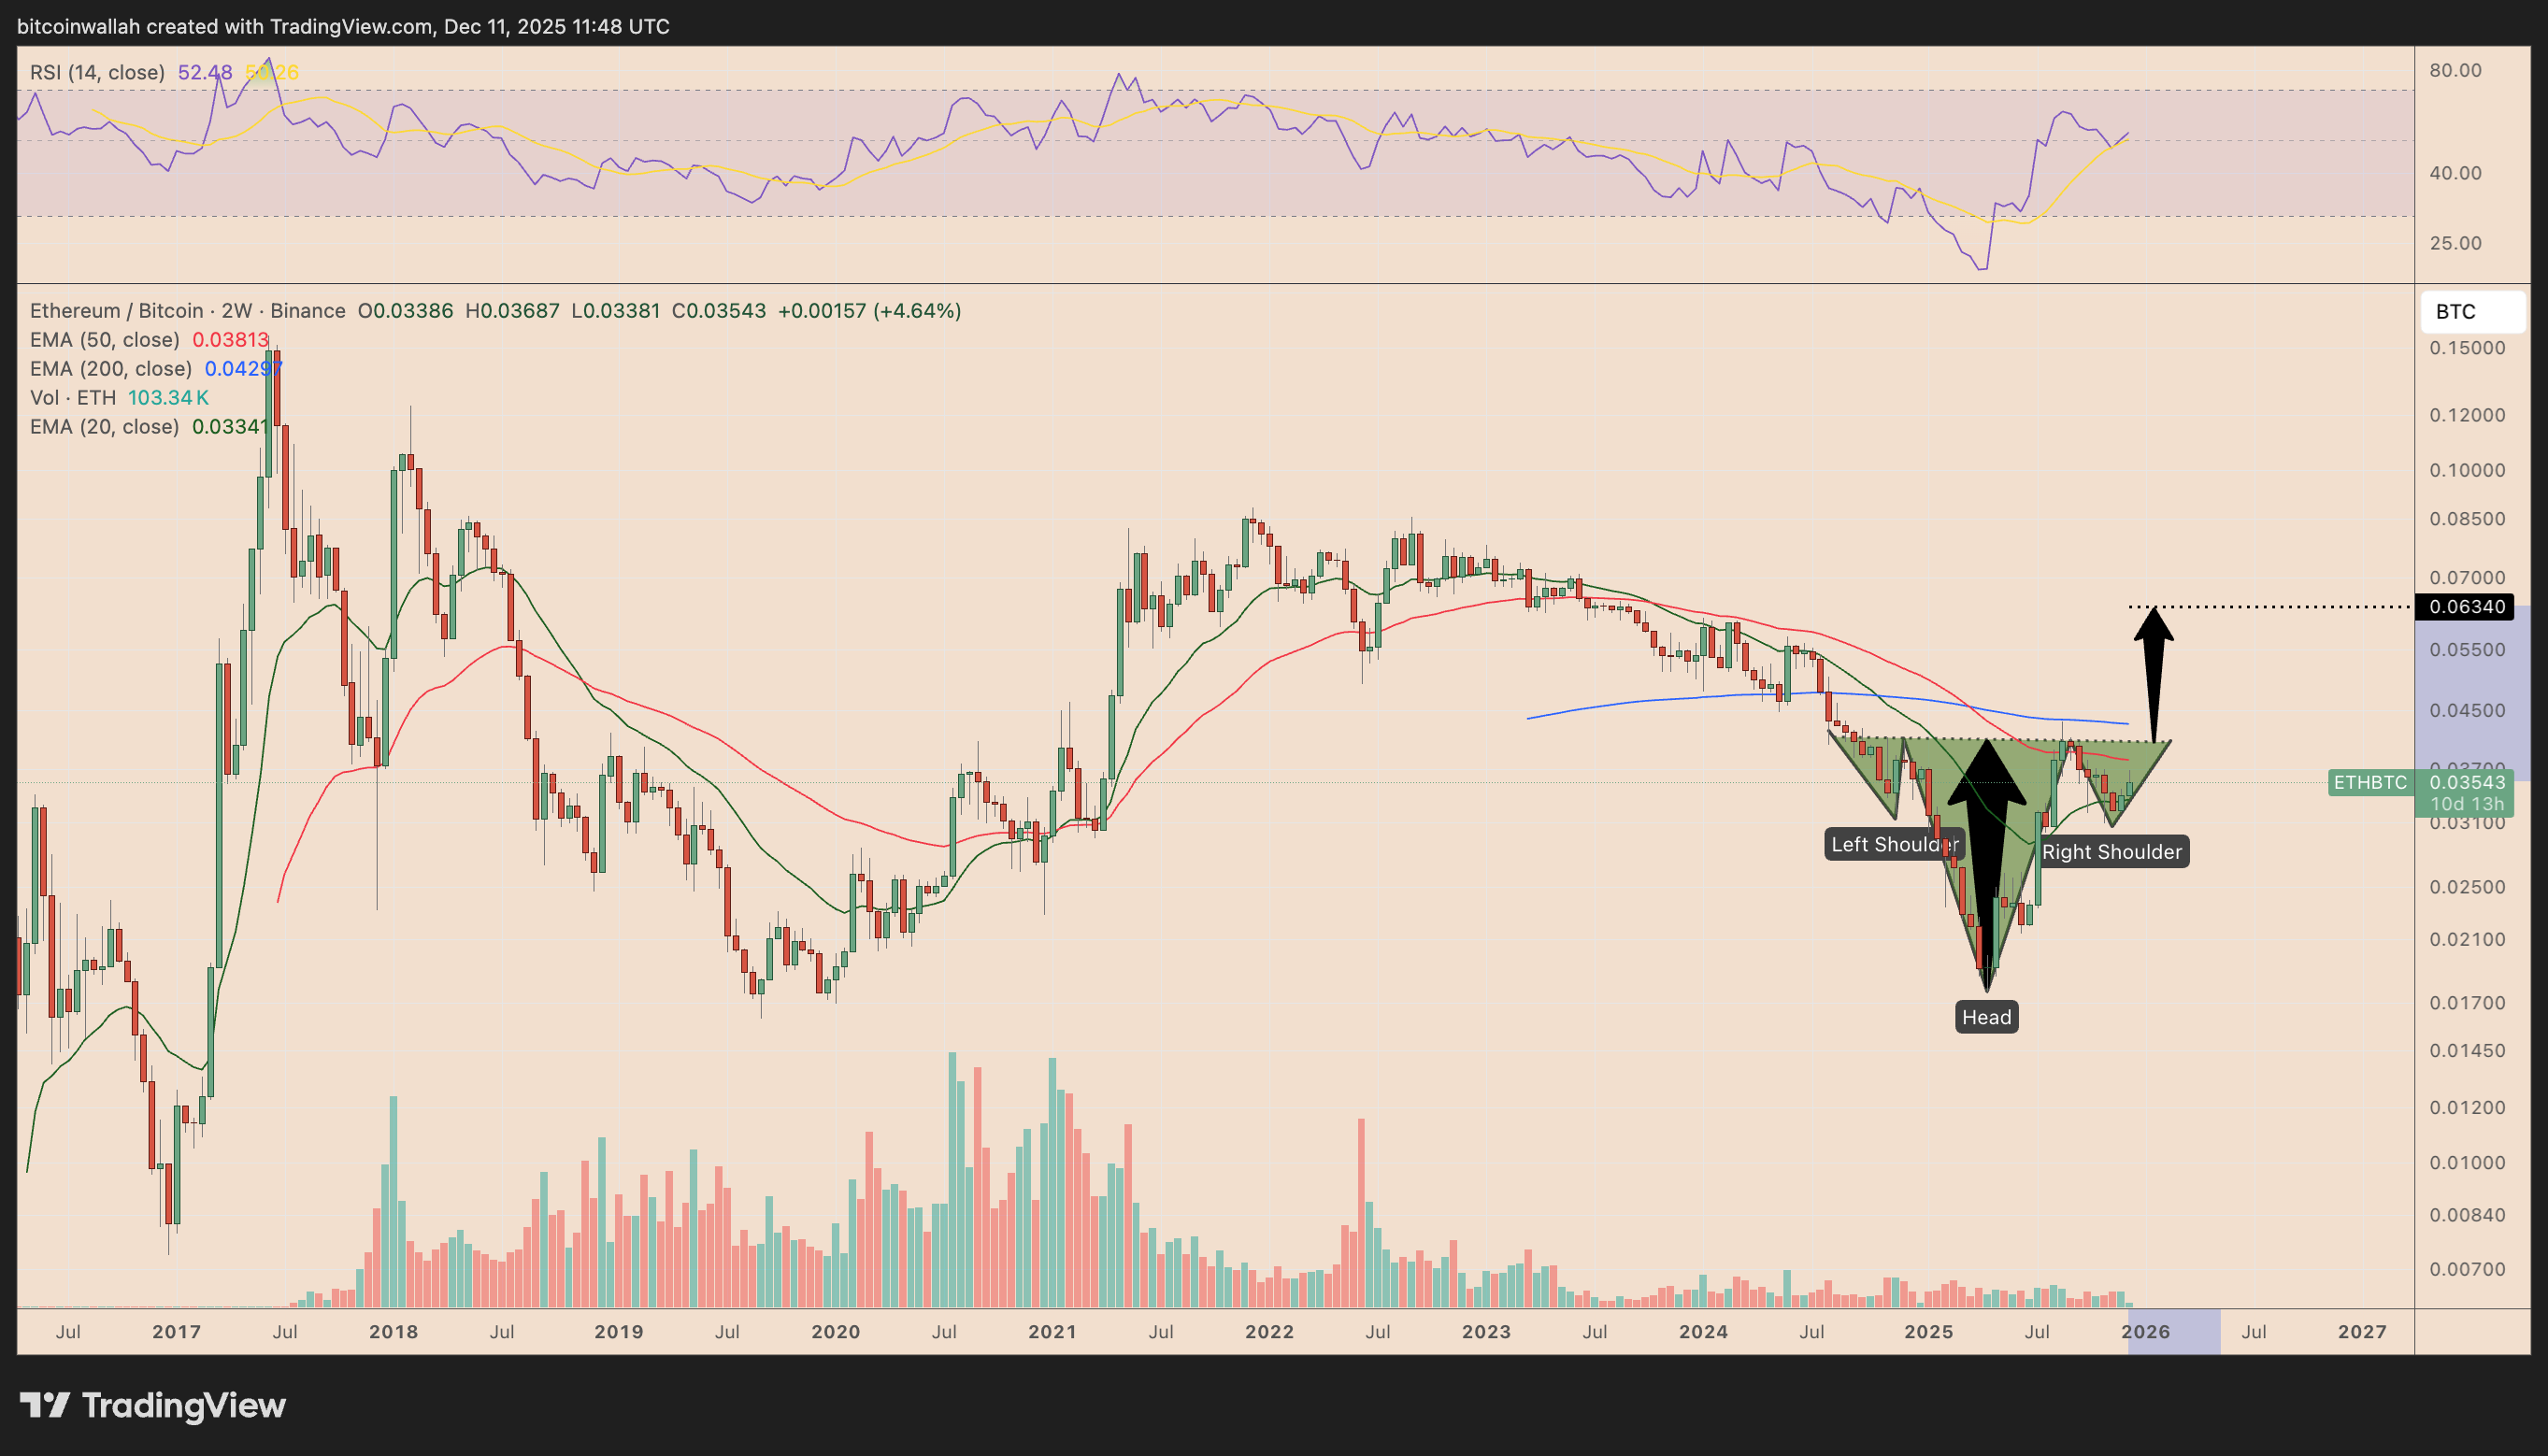
At the heart of this optimistic forecast is the inverse head-and-shoulders (IH&S) formation observed on ETH/BTC charts. This classic bullish reversal pattern is typically indicative of an impending trend change after a prolonged period of decline. The analysis suggests that the pattern’s completion could propel the ETH/BTC pair towards a target of approximately 0.059 to 0.063 BTC by 2026. This potential move represents a substantial increase from current levels, highlighting the potential for significant gains for ETH holders.
Key Price Levels and Potential Trajectories
The formation of the IH&S pattern involves several key price levels. The ‘head’ of the pattern appears to have formed around 0.0176 BTC. The ‘neckline’, a critical resistance level, is positioned around 0.0400 BTC. A decisive breakout above this neckline would serve as confirmation of the IH&S pattern, paving the way for the projected rally. The analysis also draws parallels with a previous accumulation phase in 2019-2020, where ETH/BTC saw a substantial price increase following a similar structural floor.
Fractal Analysis and Historical Context
Examining historical data, analysts have identified similarities between the current price action and the 2019-2020 period. In the previous instance, ETH/BTC rebounded strongly from a similar demand zone, leading to a parabolic expansion. If history repeats itself, ETH could climb towards the 0.059 BTC Fibonacci zone, consistent with the IH&S breakout trajectory, fueling the 80% rally projection for 2026.
Navigating the Risks: The Downtrend and Resistance
However, the analysis is not without its caveats. Ethereum remains under a long-term downtrend against Bitcoin, with a multi-year descending trendline acting as a significant resistance level. A failure to overcome this barrier could invalidate the bullish outlook, potentially leading to a pullback towards the 0.0175 BTC support level in 2026. This underlines the importance of careful risk management and independent research for any investor considering a position.
Conclusion: A Bullish, But Cautious Outlook
The potential for an 80% rally in ETH against BTC by 2026 presents an exciting proposition for crypto enthusiasts. However, the market is inherently volatile. While technical analysis suggests a favorable outlook, investors should remain cautious and informed. The success of this projection hinges on ETH breaking key resistance levels, and the overall trajectory of the broader crypto market.