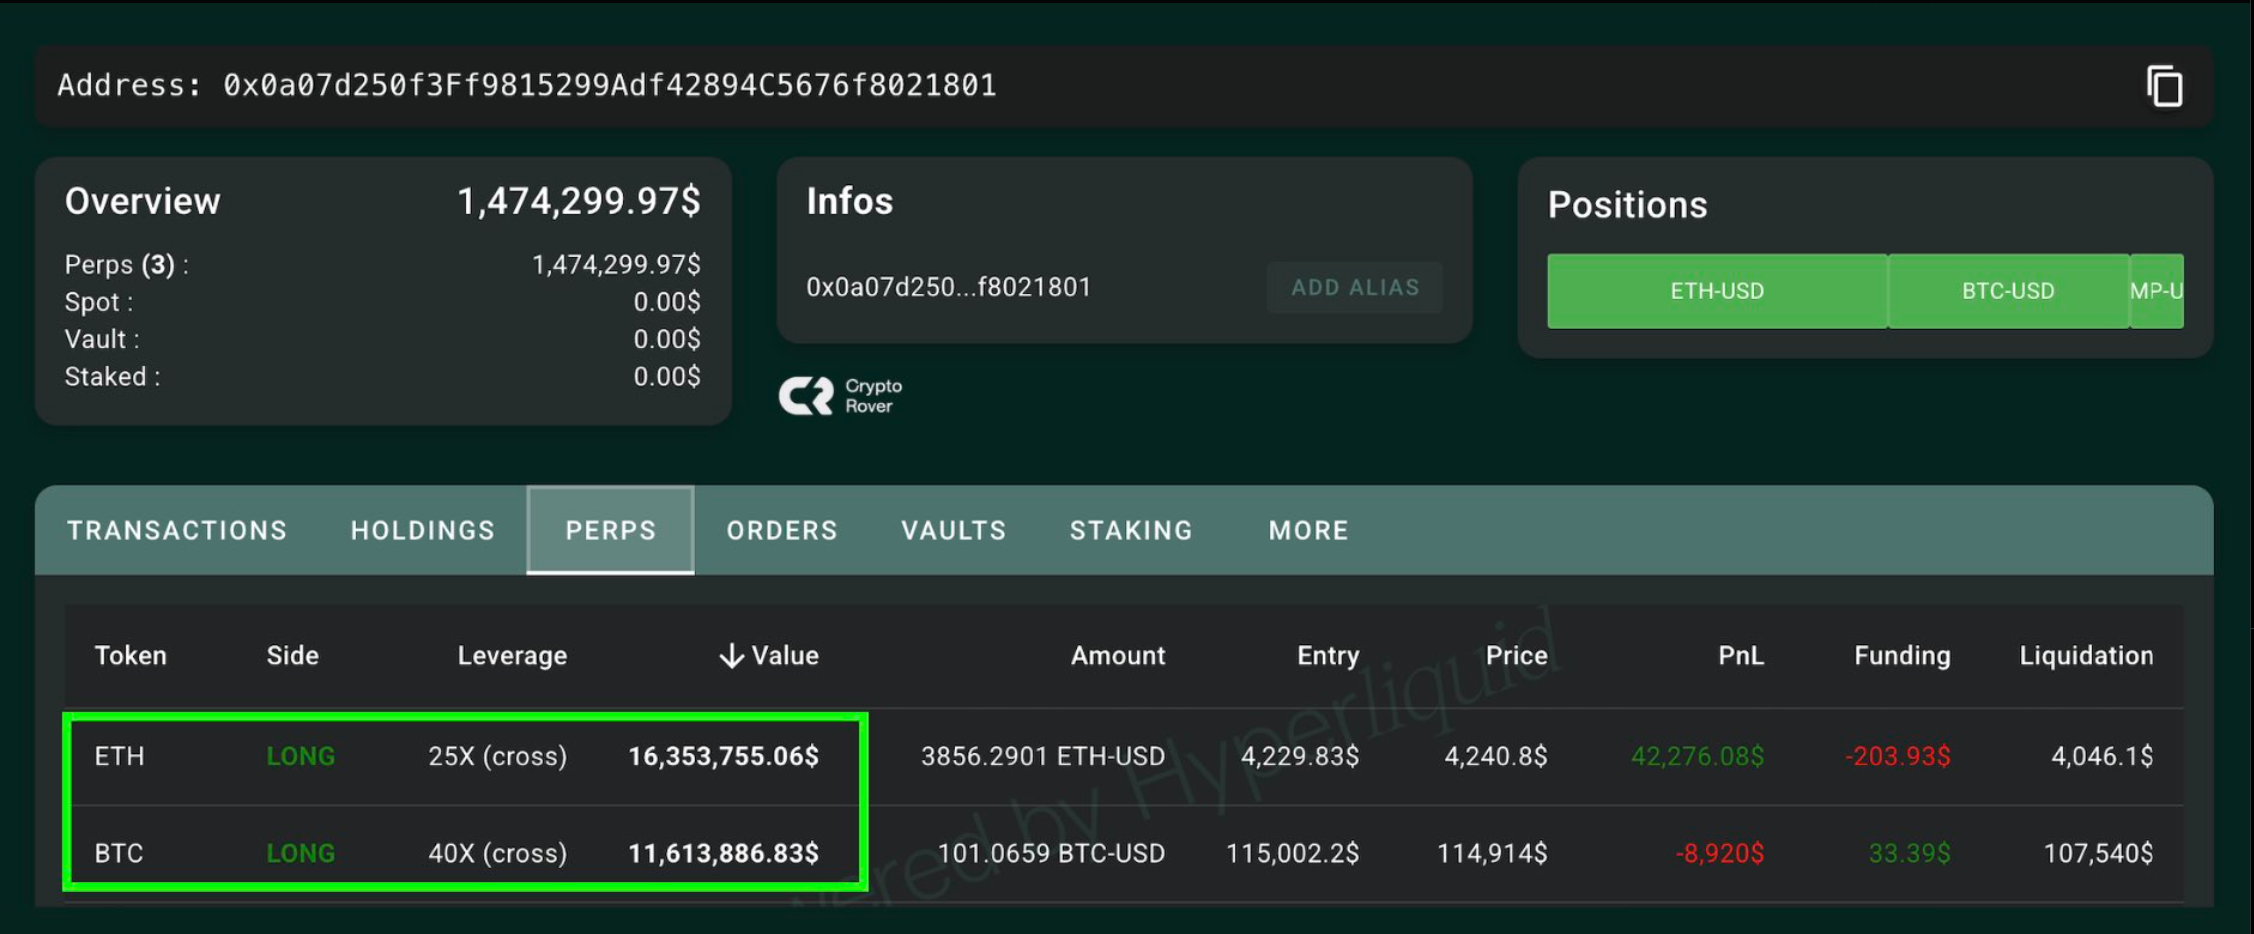
A Bold Ethereum Bet
The cryptocurrency market is abuzz as an Ethereum whale has made a significant move, opening a long position valued at $16.35 million. This aggressive bet, employing 25x leverage, suggests a strong conviction that the recent price dip in Ether (ETH) has run its course. The position, initiated at a price of $4,229.83 per ETH, is already showing signs of profitability, reflecting the volatile nature of the digital asset market. Such a leveraged position amplifies both potential gains and losses, emphasizing the high-risk, high-reward nature of this trading strategy.
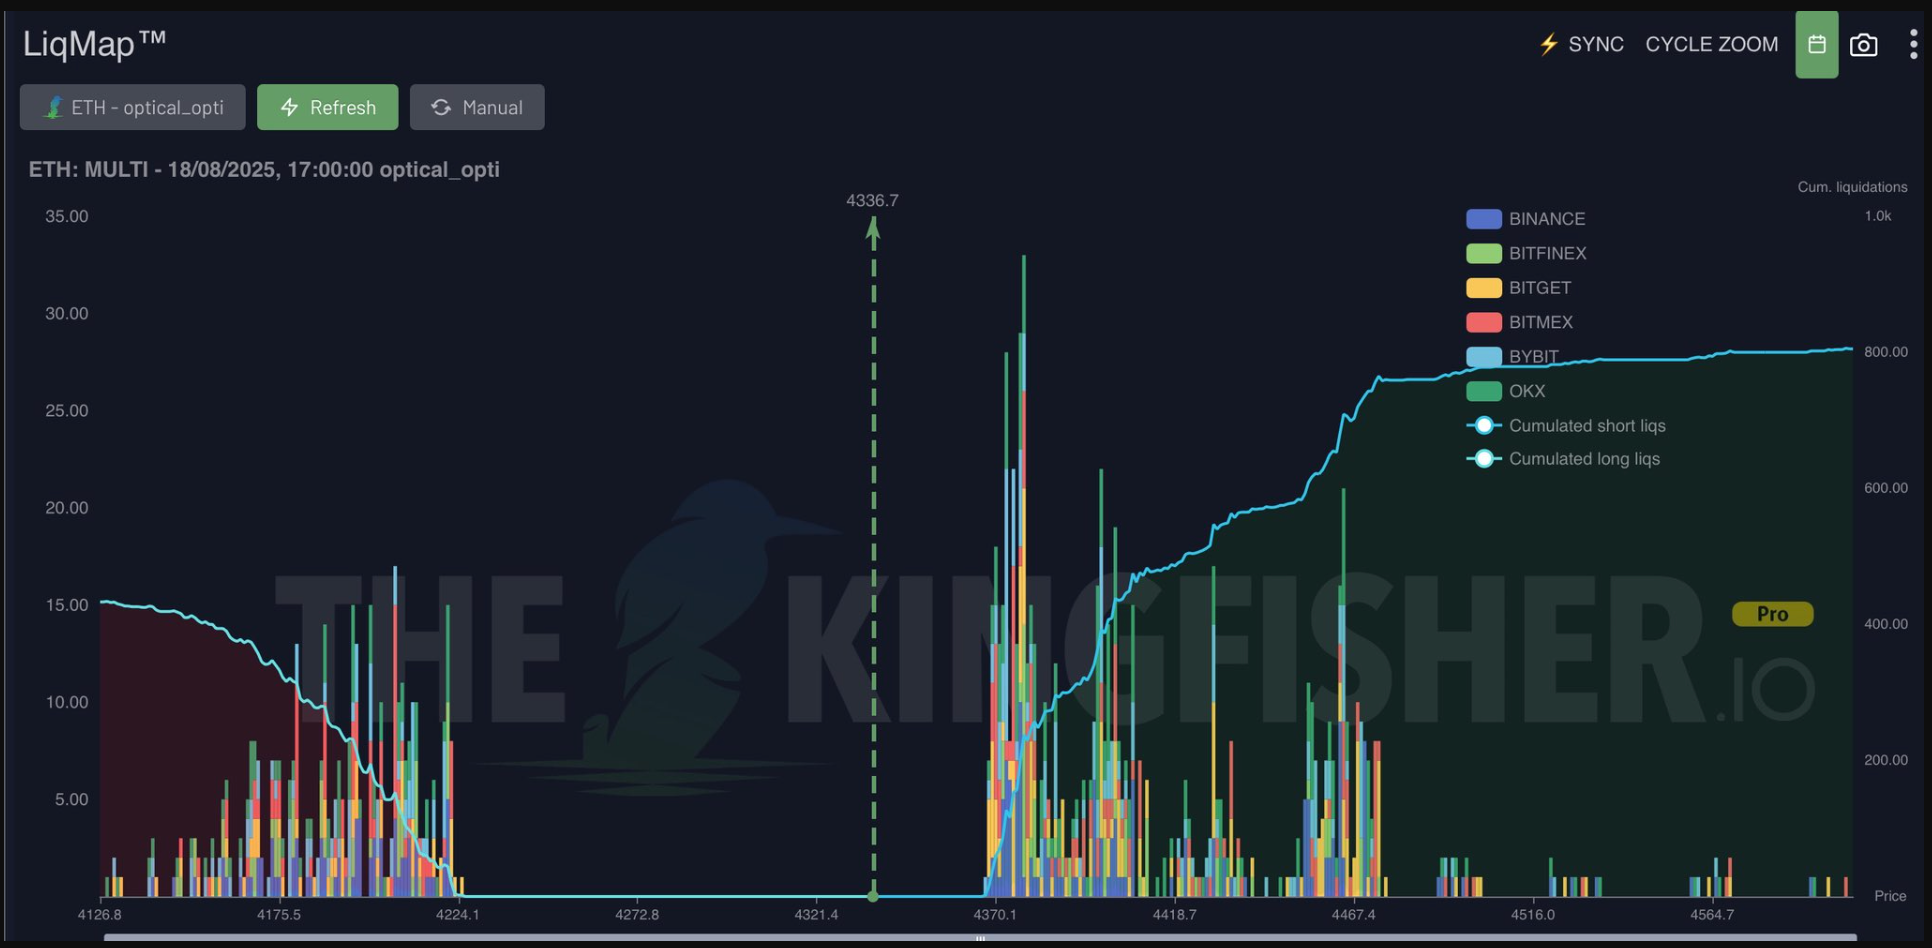
Liquidation Clusters and Market Dynamics
Market analysts are closely examining the technical details supporting the whale‘s decision. One key factor is the presence of short liquidation clusters, particularly in the $4,300-$4,360 range. These clusters act as “magnets” for market makers, potentially drawing the price towards them. This dynamic suggests that ETH doesn’t necessarily need a dramatic breakout to validate the whale‘s wager; a mere push into the aforementioned liquidity pool could yield substantial unrealized profits. The analysis indicates that if ETH reaches around $4,336, the whale‘s unrealized profit could approach $450,000. This highlights the strategic considerations behind such trades, where understanding liquidation levels becomes crucial.
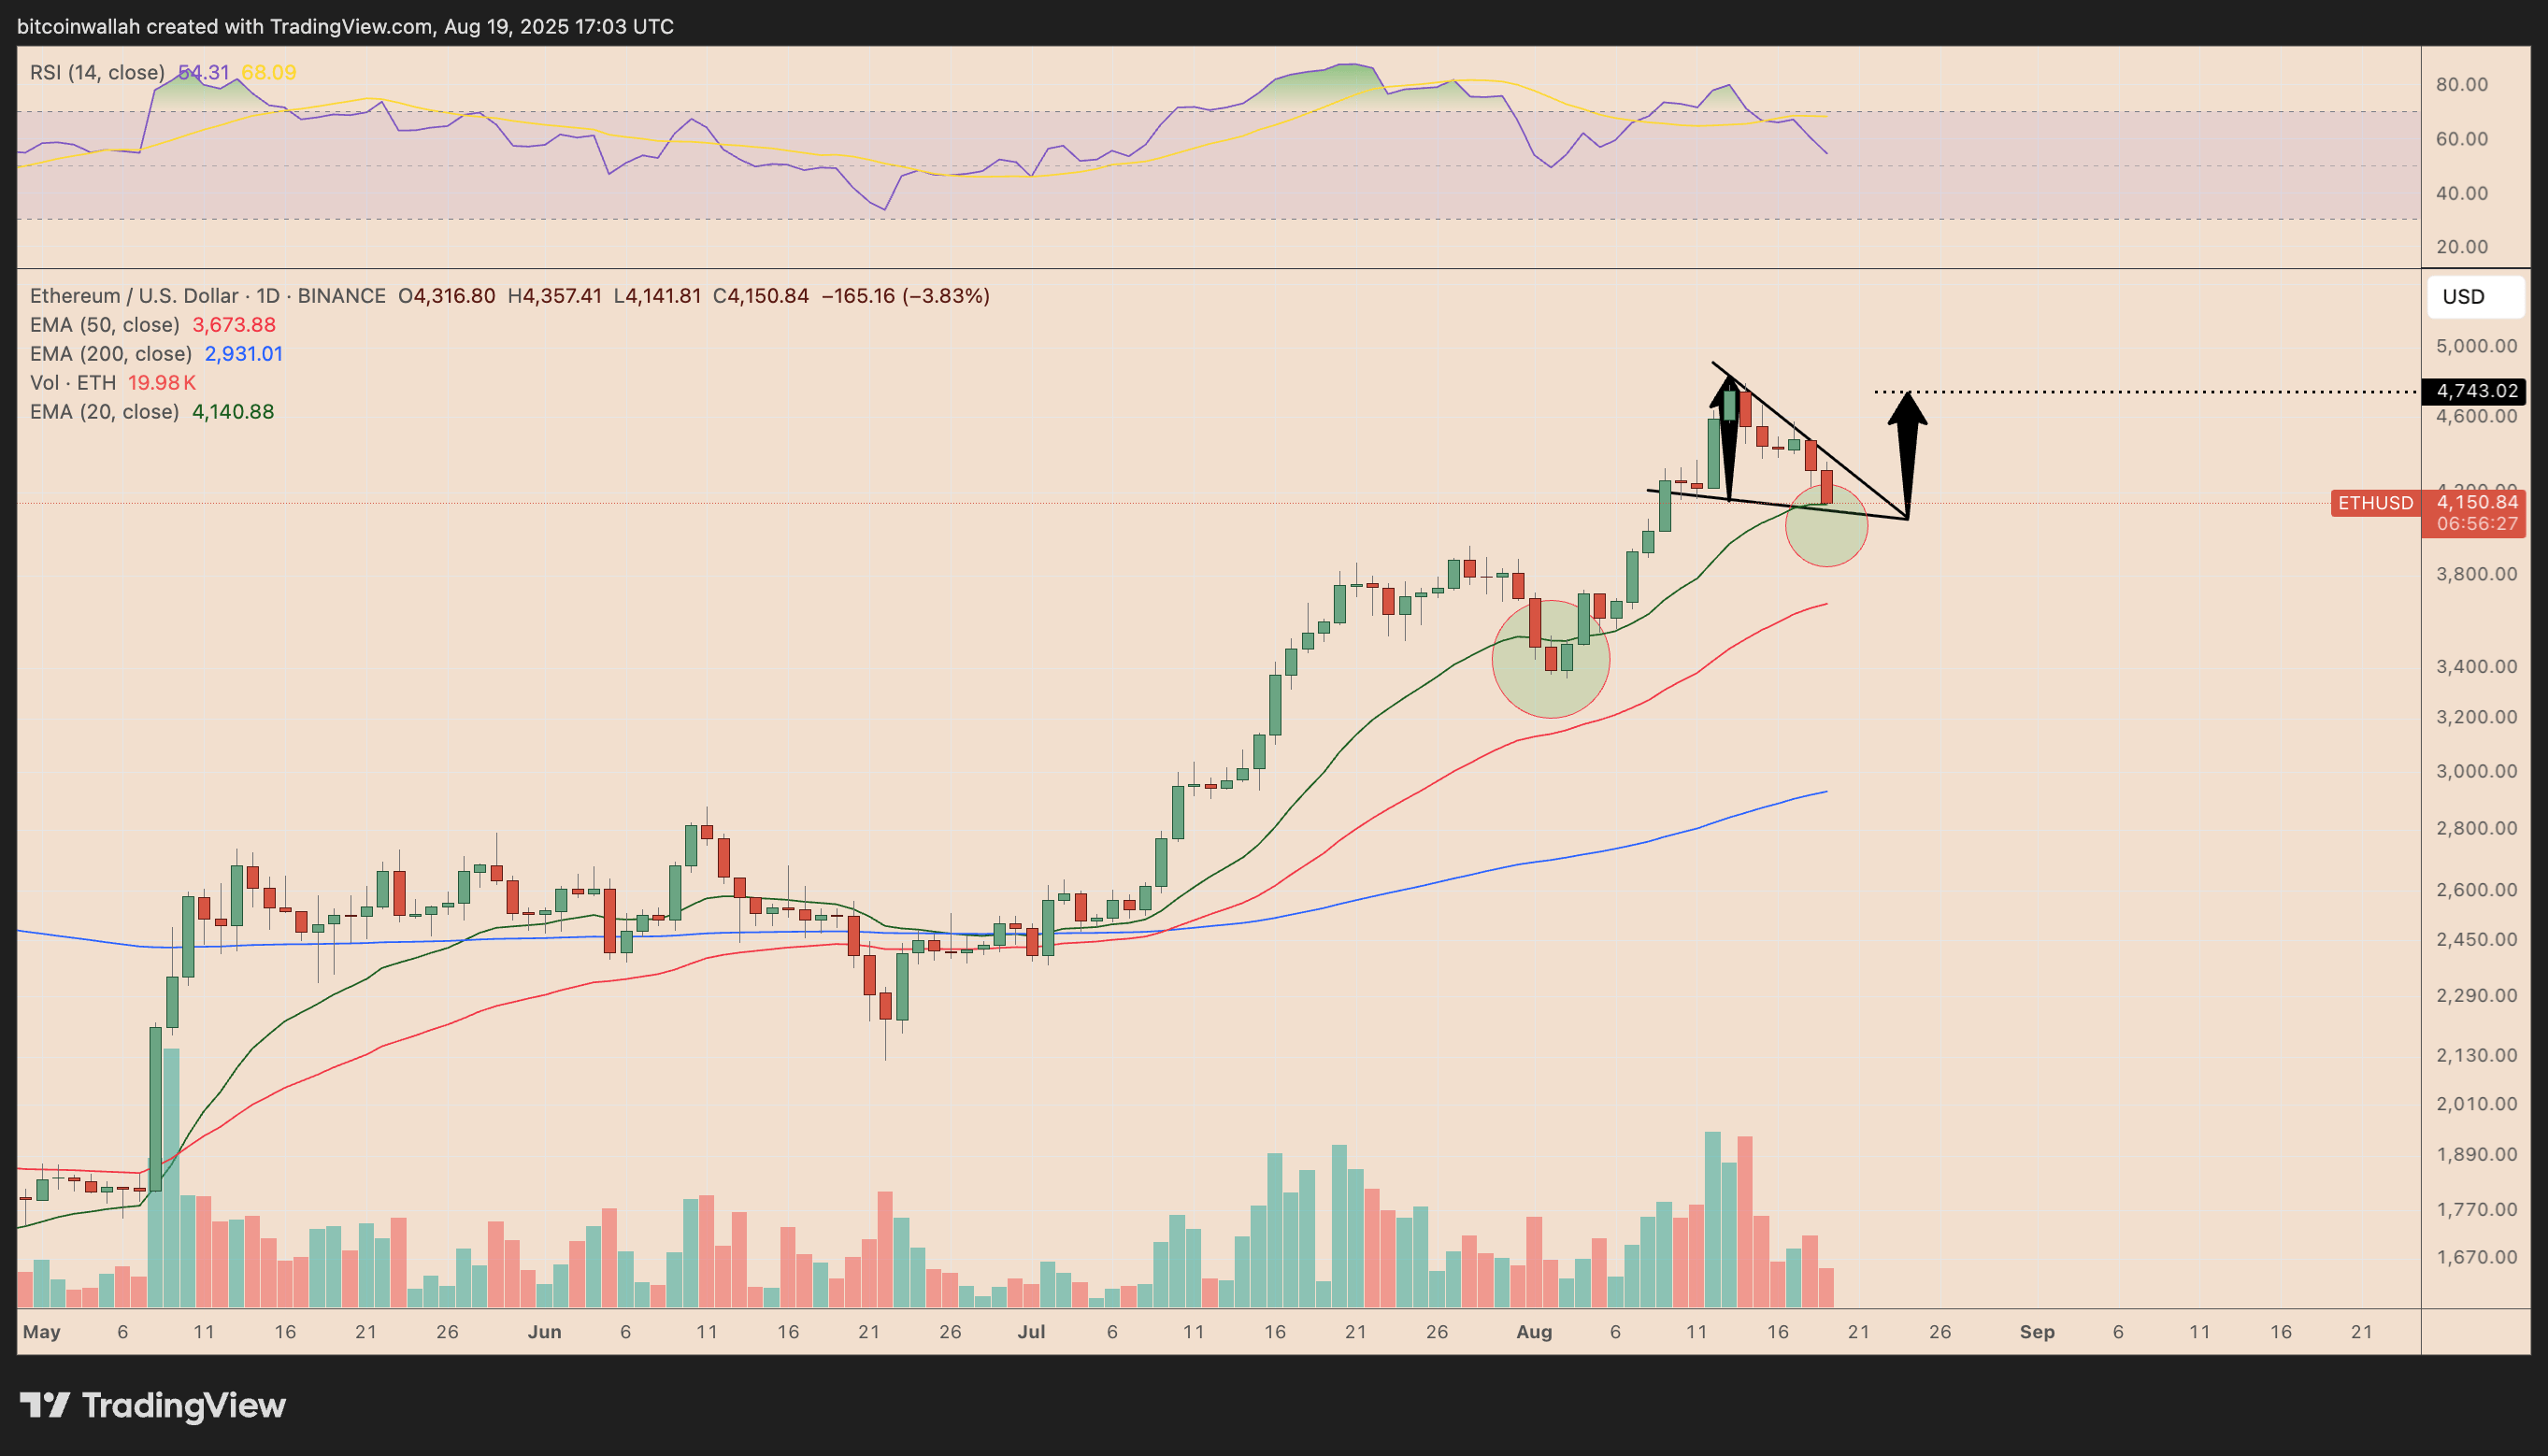
Technical Analysis: Support and Resistance
Beyond the immediate liquidation data, broader technical analysis is also at play. Ethereum is currently holding above its 20-day exponential moving average (EMA), a level that has historically provided strong support during the recent uptrend. This level now aligns with the lower boundary of a falling wedge pattern on the daily chart, a classic bullish reversal signal. This confluence of support levels strengthens the case for a potential price increase. If the wedge pattern plays out, ETH could target an upside around $4,750, nearly 13% higher than current levels. However, a break below $4,140 would likely invalidate this bullish setup, exposing the risks associated with such leveraged positions. The potential for a significant loss is also significant, with a 4.34% drop potentially wiping out the entire trade.
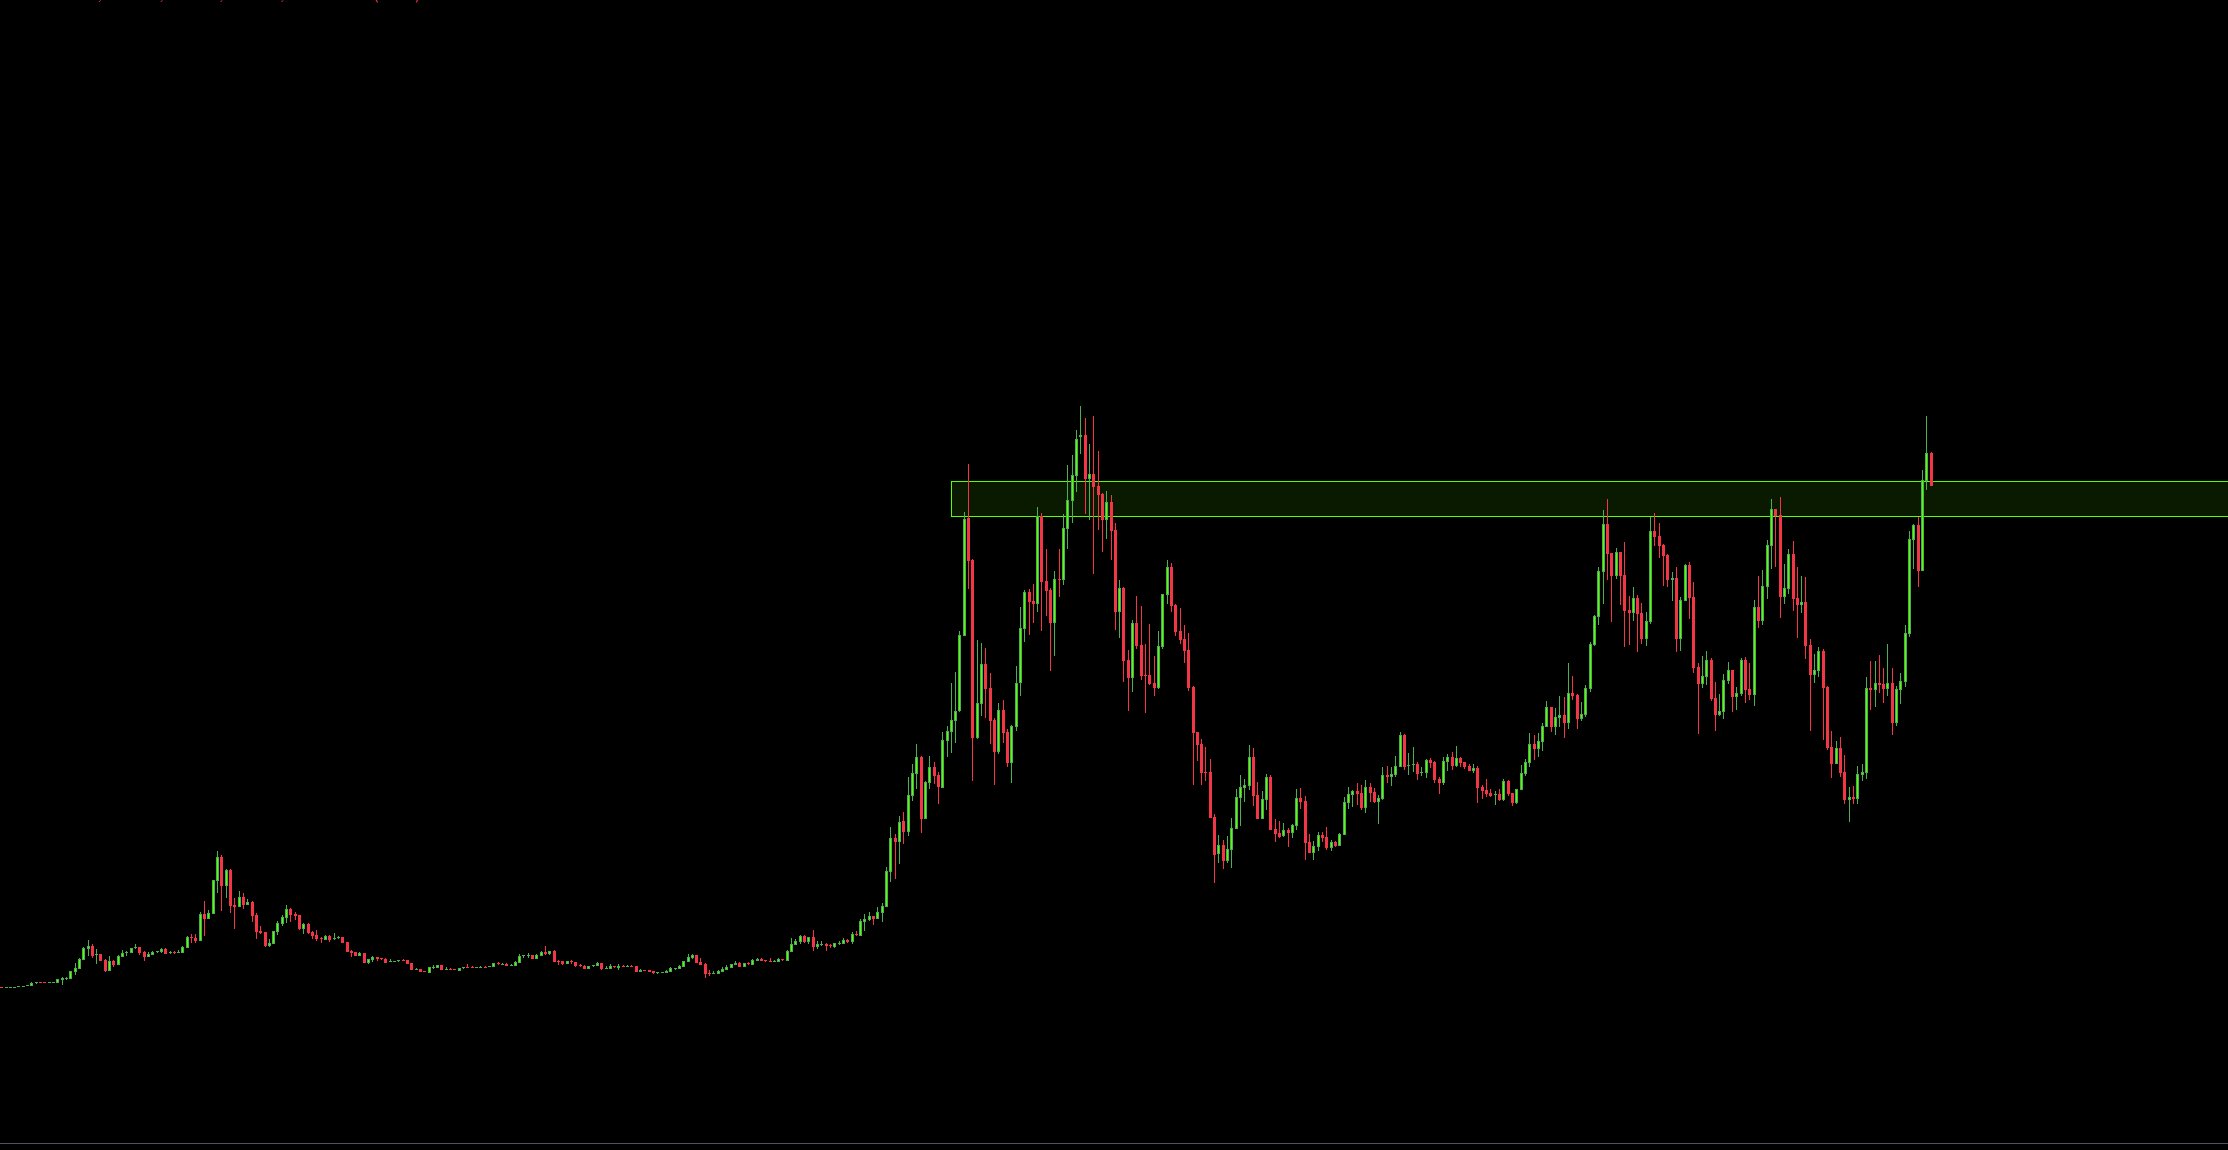
Long-Term Outlook and Market Sentiment
Looking at the weekly chart, analysts observe what is described as one of the most “obvious weekly retests” in recent years, with ETH attempting to establish the $3,900-$4,000 range as support. This perspective underscores a longer-term bullish sentiment for Ethereum, with some analysts suggesting the price could potentially reach $8,000 if this retest is successful. However, such predictions should be considered cautiously, as market conditions and unforeseen events can rapidly change the trajectory of any asset. Readers are urged to conduct their own research and consider their risk tolerance before making any investment decisions in the volatile crypto market.