

XRP: A Potential Spring Awakening in March?
The cryptocurrency XRP has faced significant headwinds, shedding over half its value since October 2025. With five consecutive months of losses, the question on many investors’ minds is: Can March finally bring a change of fortune for XRP? Technical analysis suggests a potential for a bullish reversal, and some key on-chain indicators offer hints of renewed strength.
Double Bottom Formation: A Textbook Reversal?
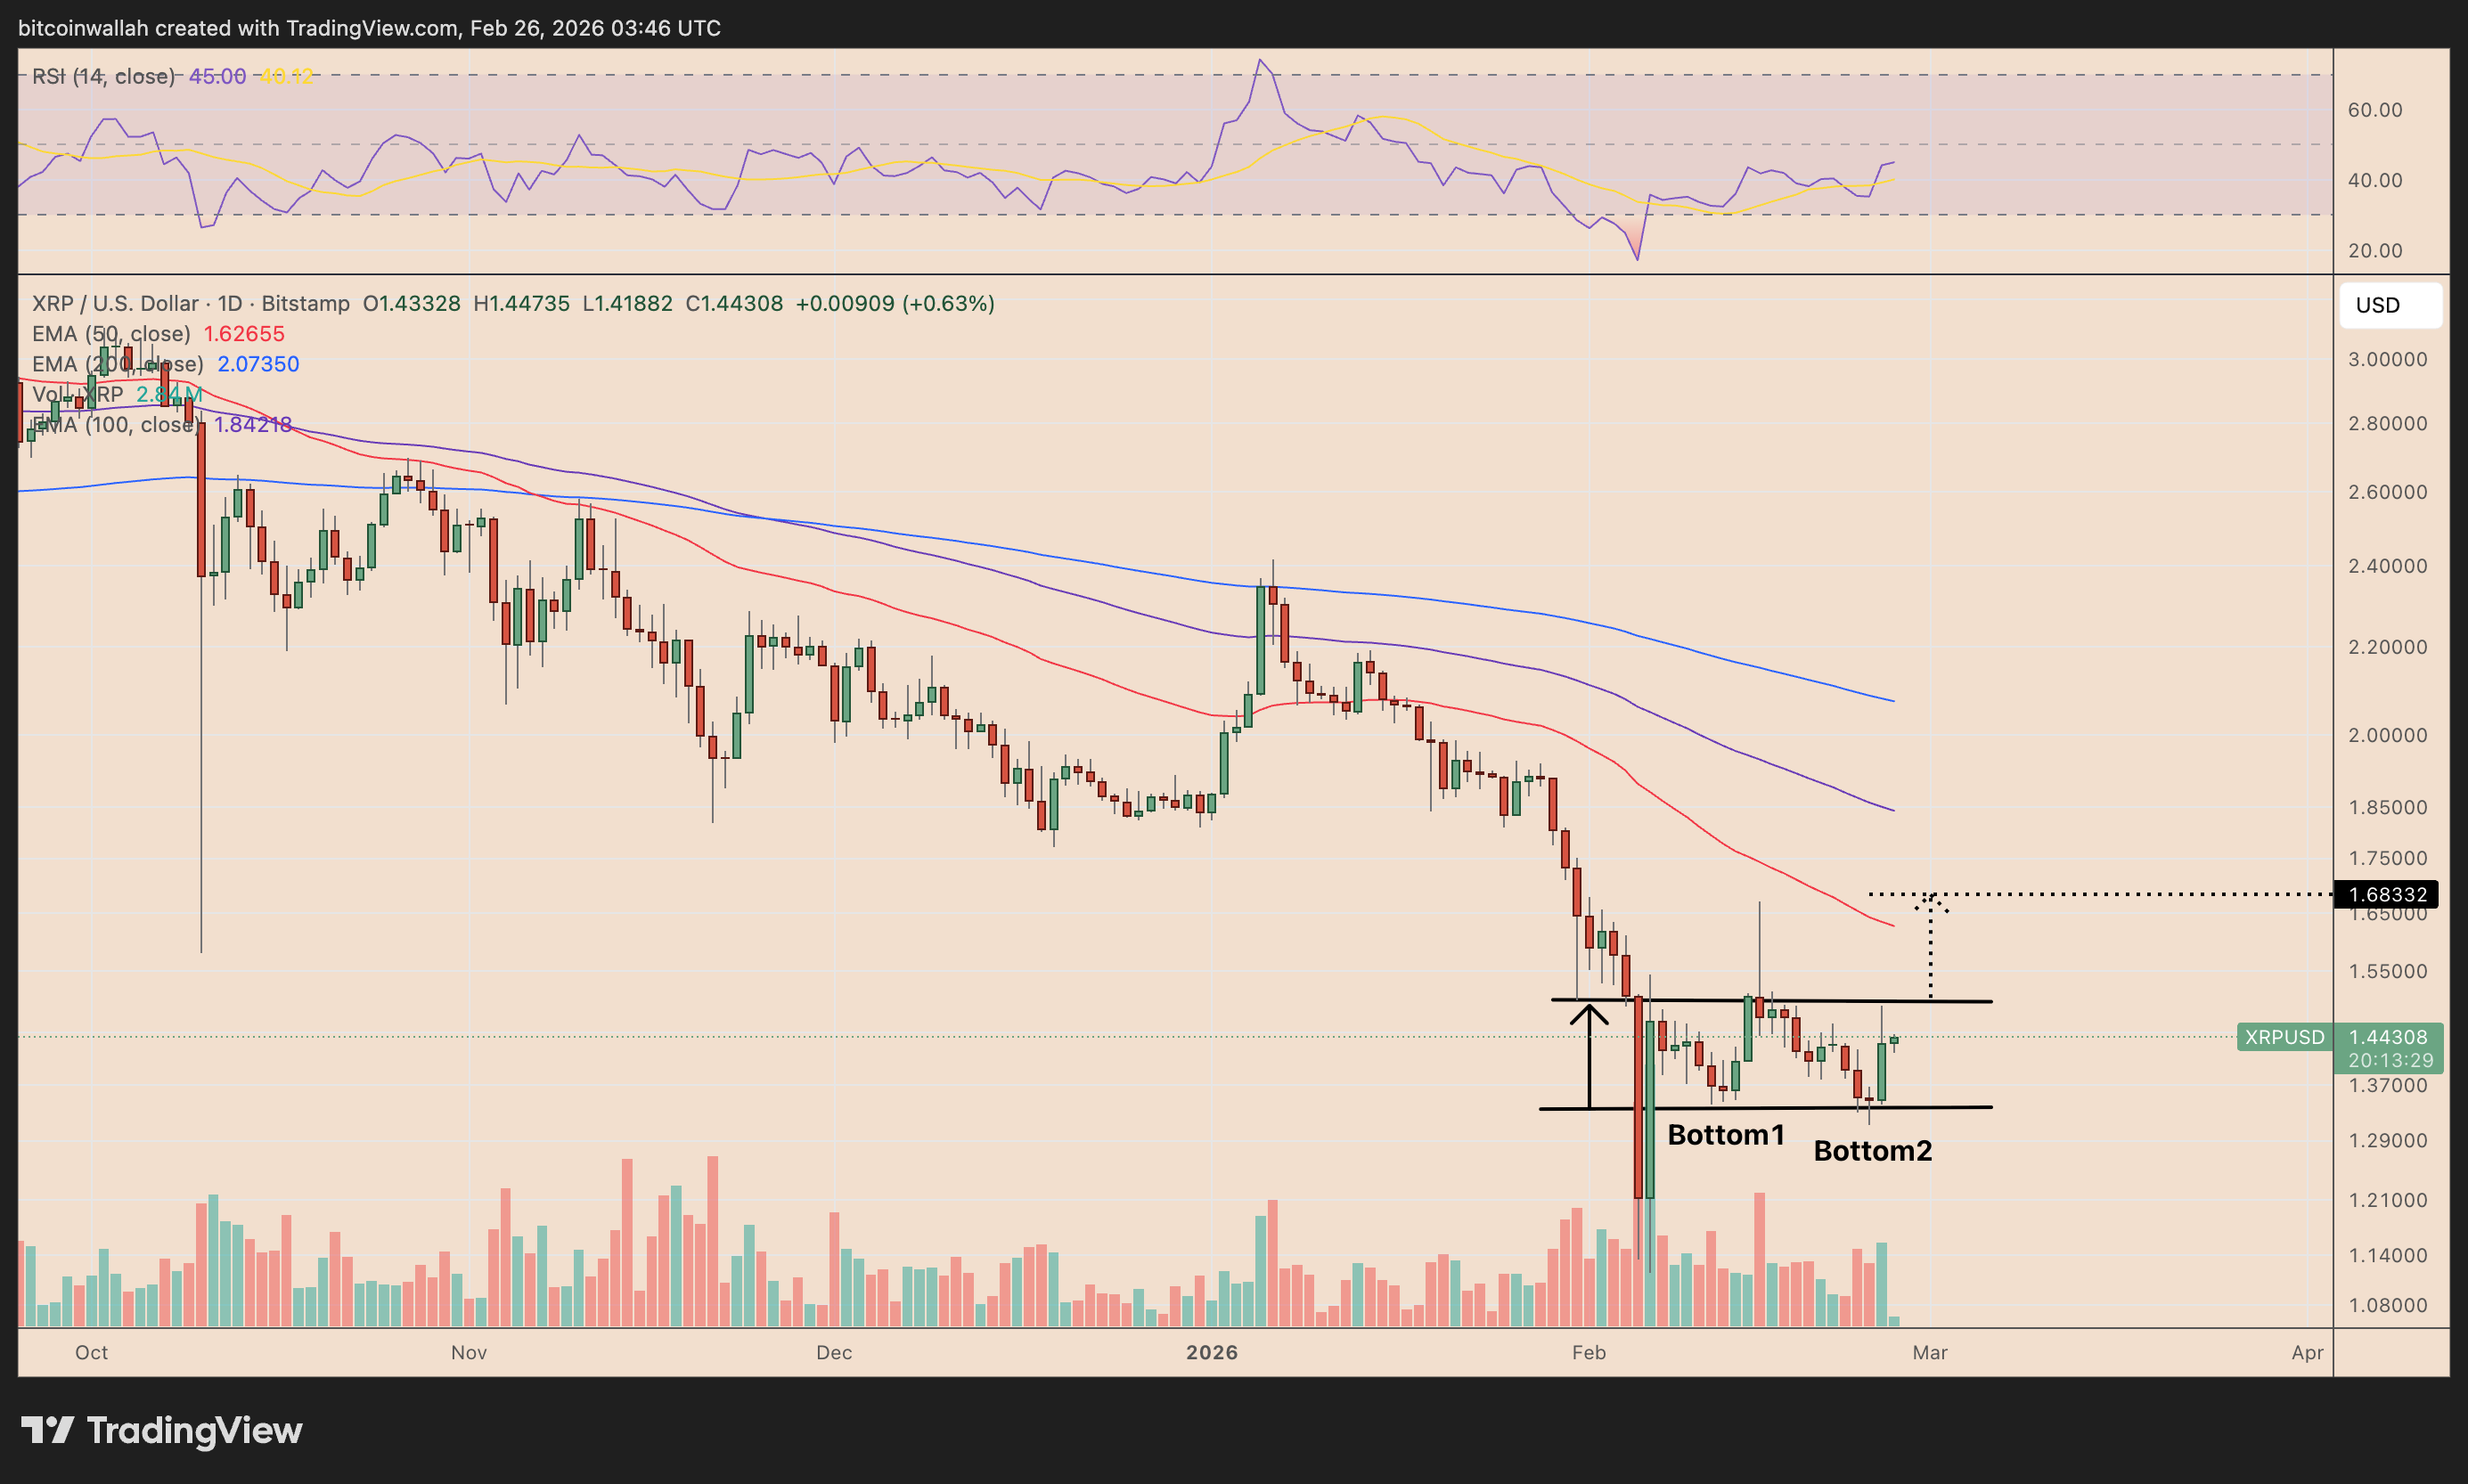
XRP‘s recent price movements are drawing attention to a classic technical pattern: the double bottom. This pattern, characterized by two distinct price lows at roughly the same level, often signals a potential trend reversal. In XRP‘s case, the repeated holding of the $1.30–$1.35 support area in February has formed the basis of this pattern. If XRP breaks above the neckline of this pattern, which is currently near $1.50, the technical target could be a rally to the $1.68–$1.70 range, representing a roughly 20% increase from current levels.

Whale Activity: Are the Big Players Accumulating?
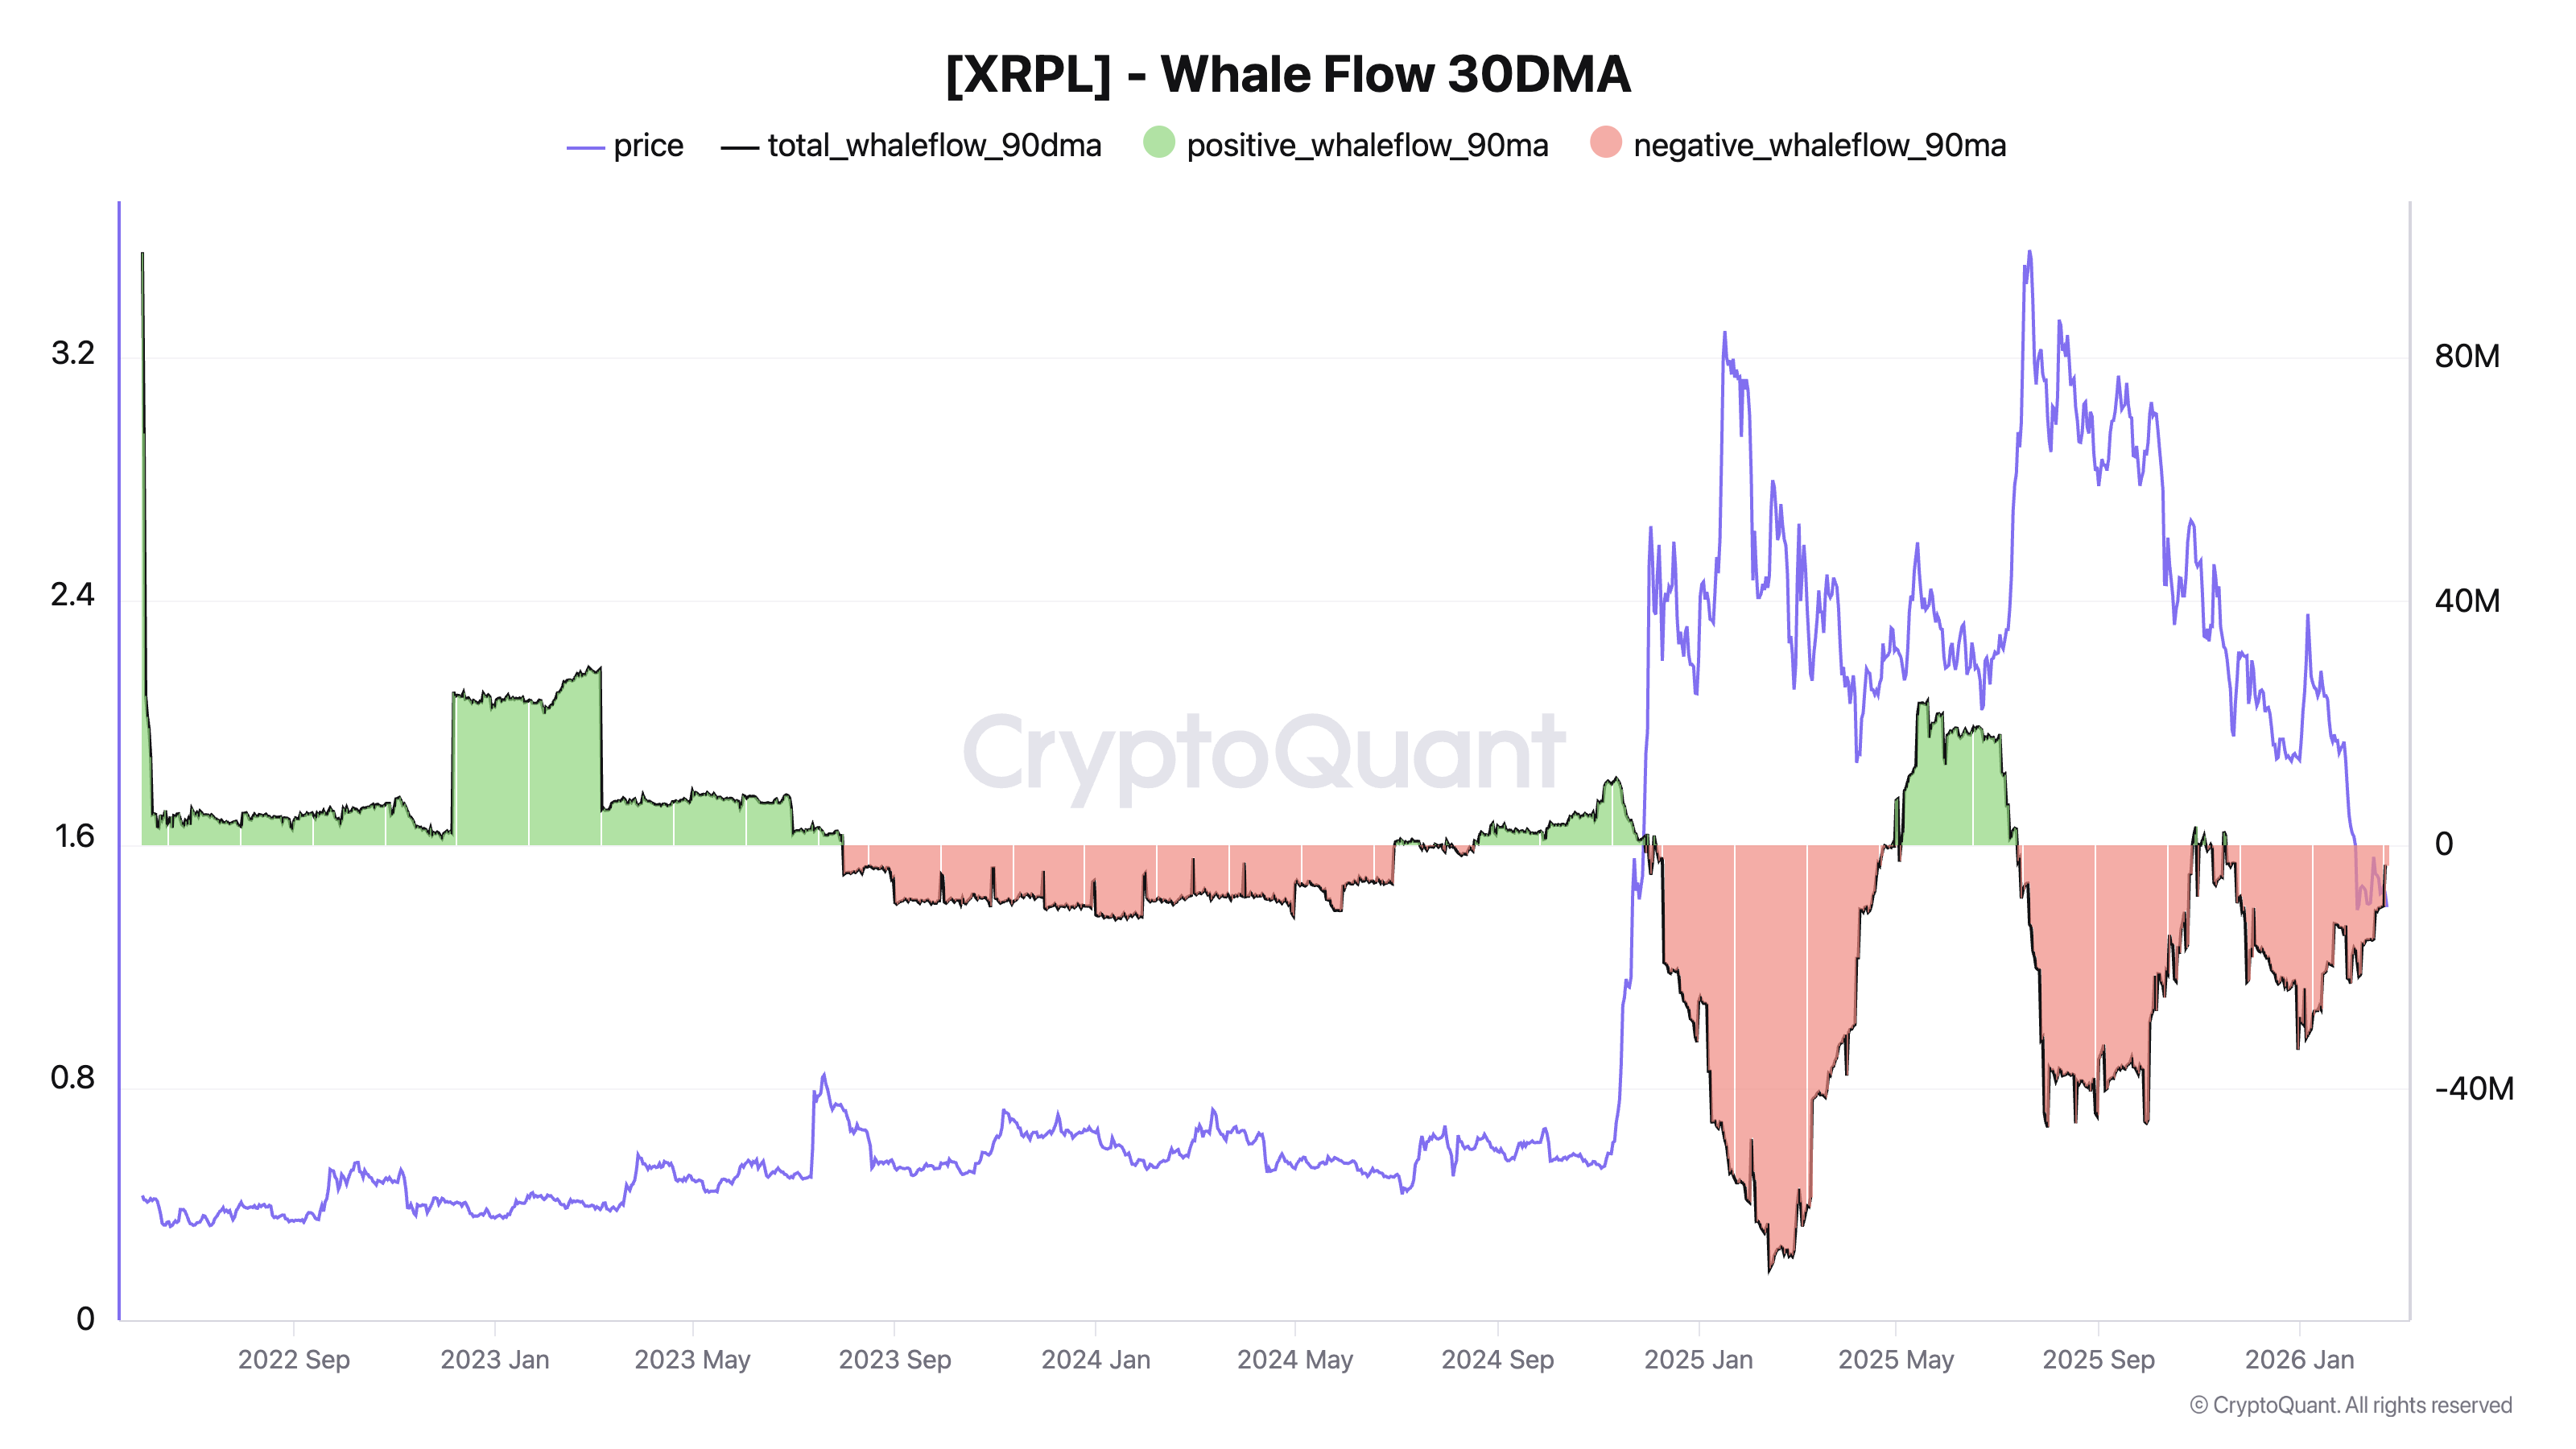
A crucial factor to consider is the activity of XRP whales – large holders of the token. Data from CryptoQuant indicates that whale selling pressure has been easing recently. The 90-day moving average of whale outflows has shrunk considerably, suggesting a reduction in the rate at which these large players are selling their holdings. Additionally, the supply of XRP held by wallets with significant balances (at least 1,000 tokens) has begun to rise. This could indicate that whales are no longer actively selling and might even be starting to accumulate more XRP near current price levels.
This is a positive sign. A similar easing of whale flows was observed in April 2025 which was followed by a significant XRP price rebound of over 50%.
Potential Roadblocks: Resistance and Macro Risks
While the technical and on-chain indicators offer encouraging signs, several factors could impede XRP‘s potential rally. The $1.68–$1.70 target area coincides with XRP‘s 50-day Exponential Moving Average (EMA). This level has acted as resistance throughout February, and a failure to break above it could stall the bullish momentum. Furthermore, broader market risks also cast a shadow. The return of AI-driven risk-off trades and increasing geopolitical tensions, such as those between the U.S. and Iran, could drain liquidity from high-beta assets like XRP, making it harder for the cryptocurrency to sustain any price gains.
Conclusion: Navigating the Uncertainty
The outlook for XRP in March presents a mixed bag. The double-bottom pattern and easing whale selling are promising signs. However, the presence of strong resistance and potential macro headwinds introduces an element of uncertainty. Investors should carefully monitor the price action, whale activity, and broader market sentiment to make informed decisions. A break above the neckline of the double bottom would significantly strengthen the bullish case. However, a failure to do so, combined with bearish market pressures, could lead to further downside risk.