XRP’s Price: A Delicate Balancing Act
The cryptocurrency XRP finds itself at a precarious juncture, with several indicators flashing potential warnings signs while offering a glimmer of hope. Recent market movements, combined with on-chain data and technical analysis, paint a complex picture for the digital asset. The price of XRP is currently trading under pressure, reflecting broader market trends and investor sentiment, but crucial support levels could determine its next major move.
Declining On-Chain Activity and Investor Hesitation
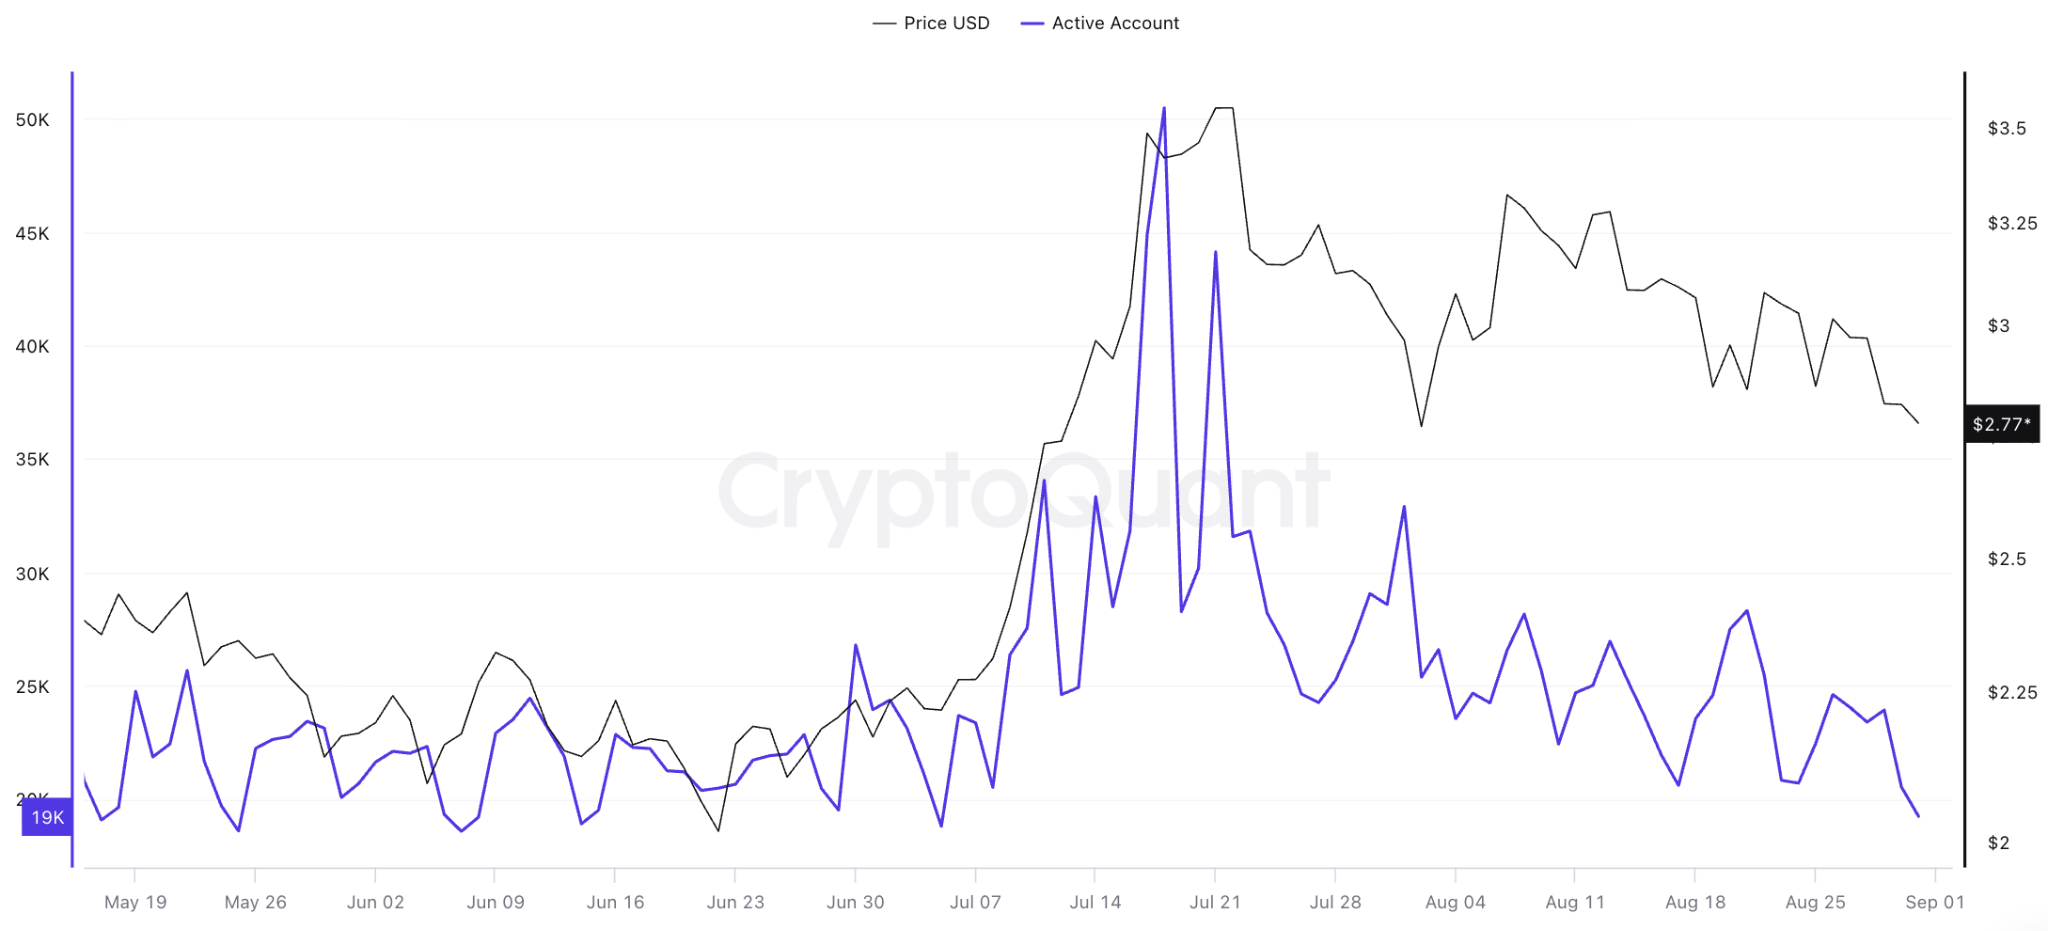
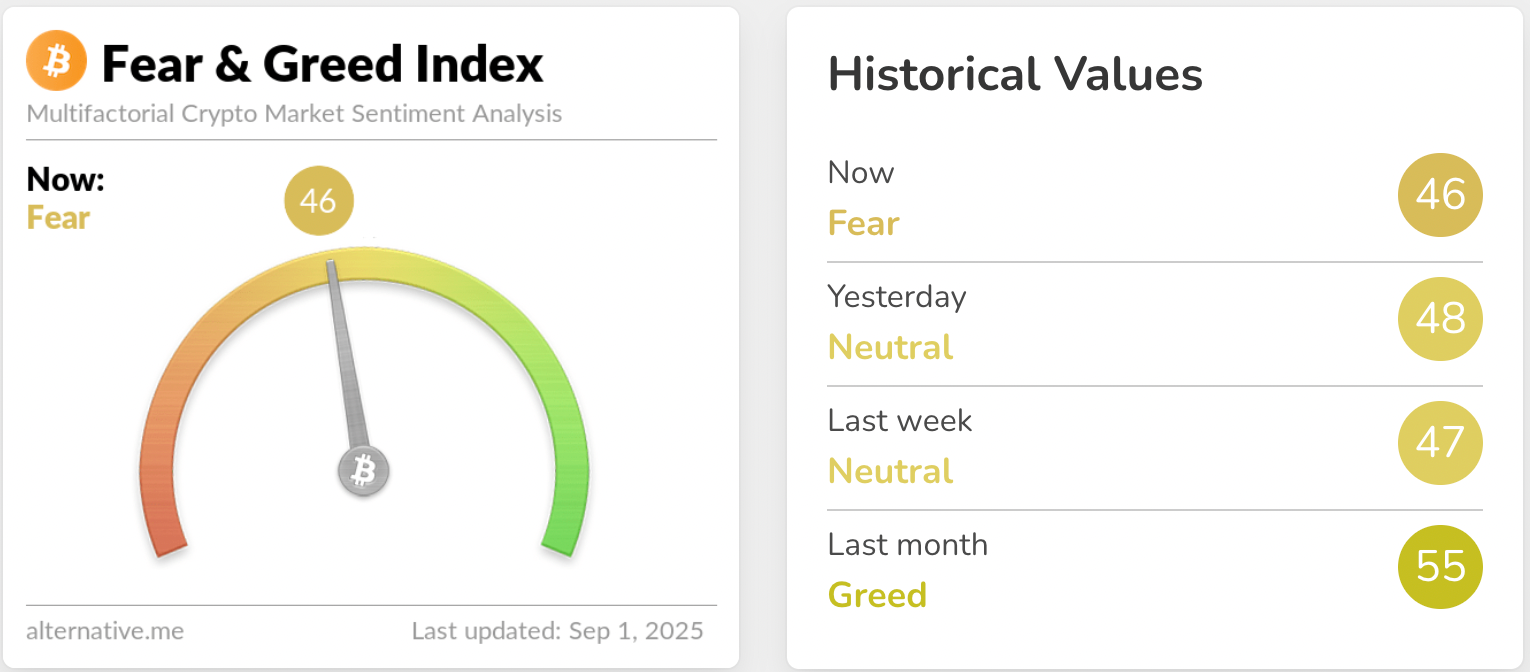
One key factor influencing XRP’s price is the declining on-chain activity. The number of active addresses on the XRP Ledger (XRPL) has significantly decreased in recent weeks. This metric, tracking wallets actively interacting with the network, plummeted from approximately 50,000 in mid-July to 19,250, signaling reduced risk appetite among investors. This reduced engagement increases the likelihood of sell-offs and downward price pressure. The Crypto Fear & Greed Index, currently in the “fear” zone, mirrors this cautious sentiment.
Open Interest Signals a Potential Downtrend
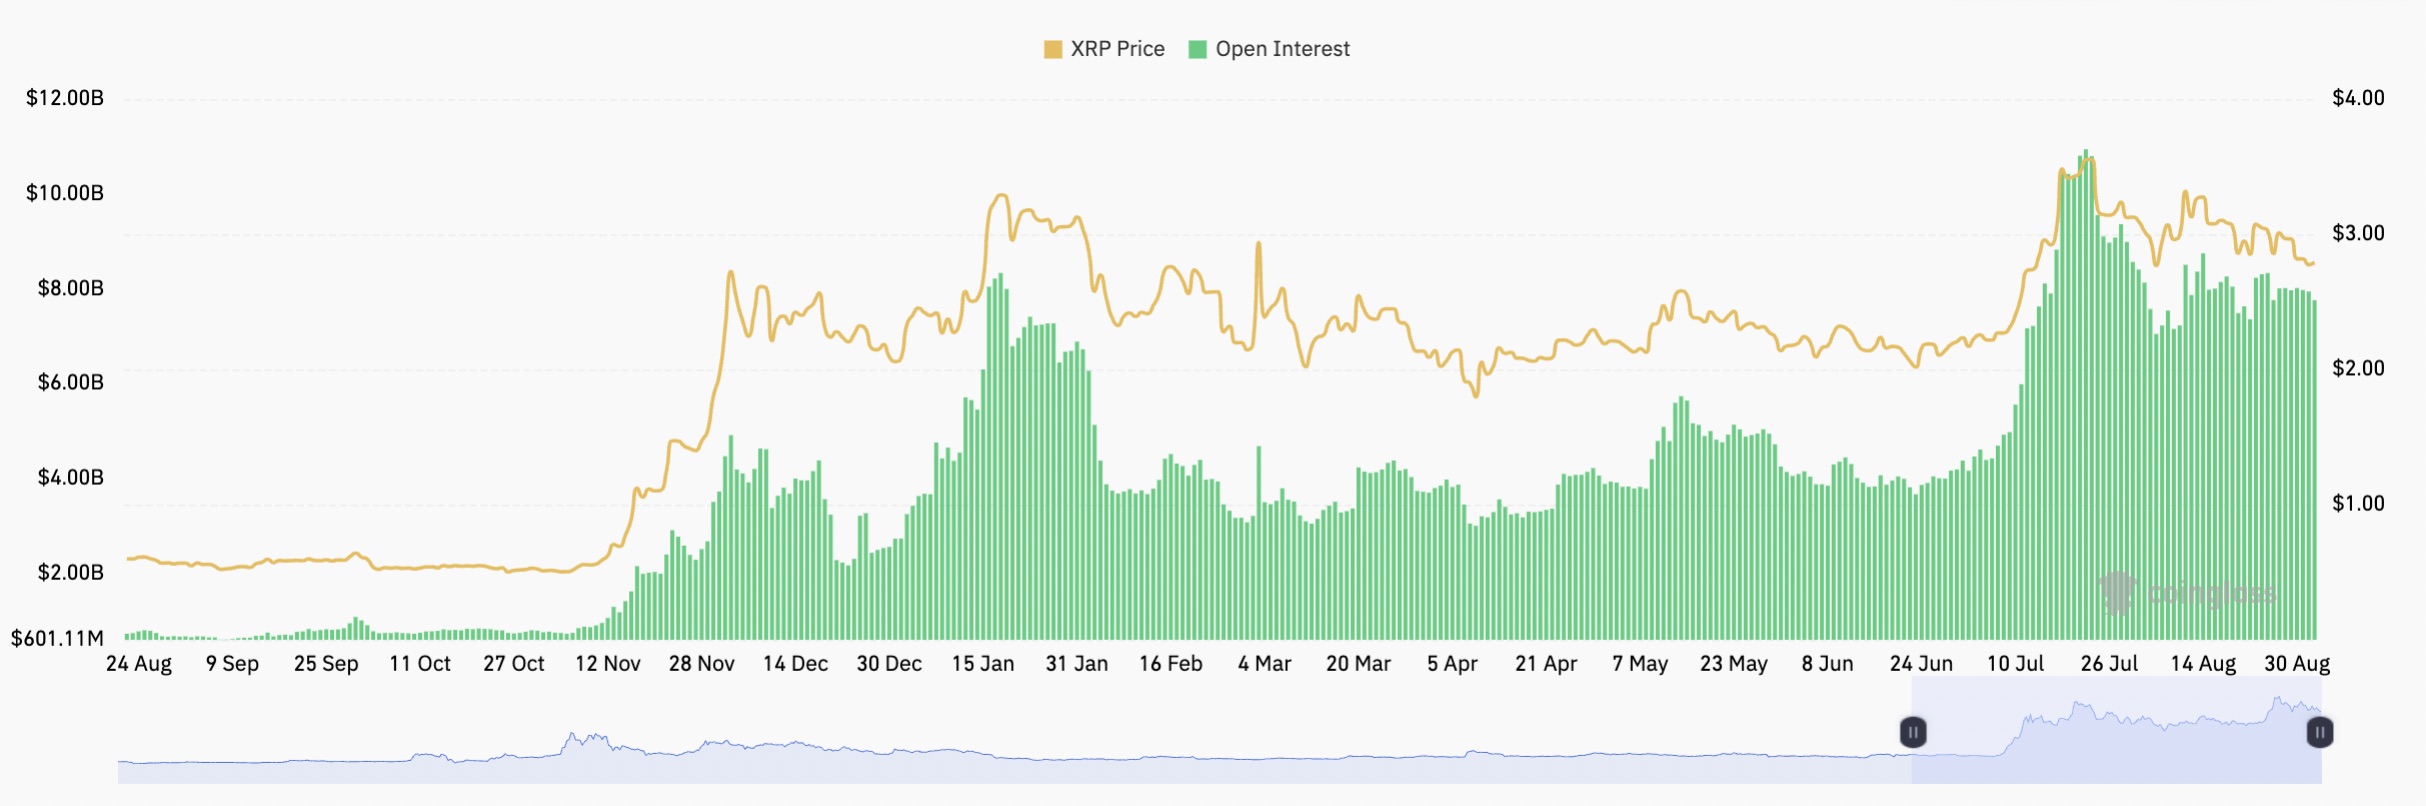
Further compounding the bearish outlook is the decline in futures open interest (OI). The pullback in OI, from $10.94 billion to $7.7 billion, demonstrates a lack of investor conviction. Diminishing OI often precedes continued downtrends, as it indicates less speculative interest and less willingness to bet on XRP’s future price movements. This, along with the overall market sentiment, creates a challenging environment for XRP’s price to maintain upward momentum.
Technical Analysis: The $2.70 Support Level
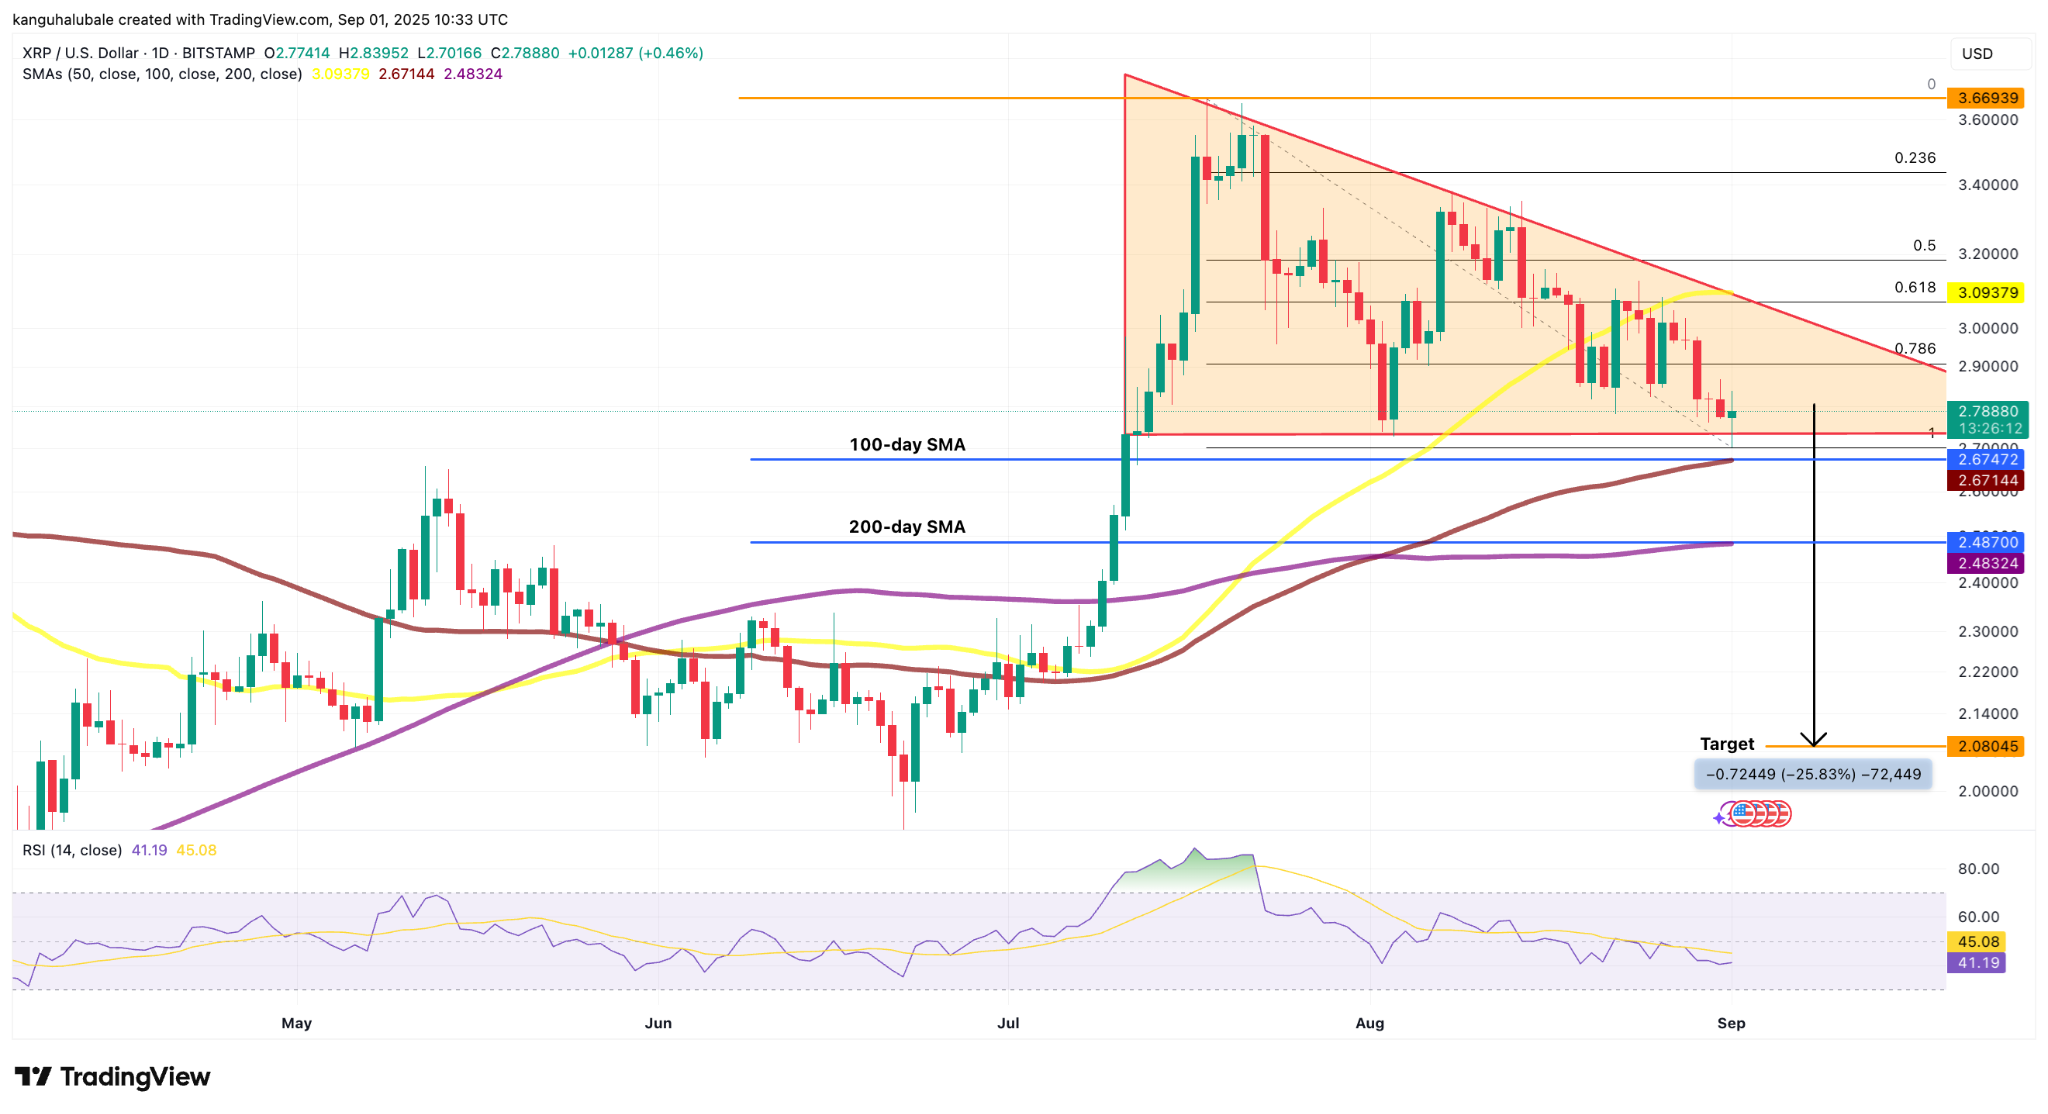
From a technical perspective, the $2.70 level serves as a critical support zone for XRP. The daily chart has formed a descending triangle pattern, a bearish reversal indicator. If the price breaks below $2.70, a significant decline towards the $2.00 mark could occur. This breakdown could trigger further selling pressure and accelerate the downtrend. The presence of the 100-day and 200-day Simple Moving Averages (SMA) at $2.60 and $2.48 respectively, could offer some form of a safety net.
Potential Reversal Scenarios
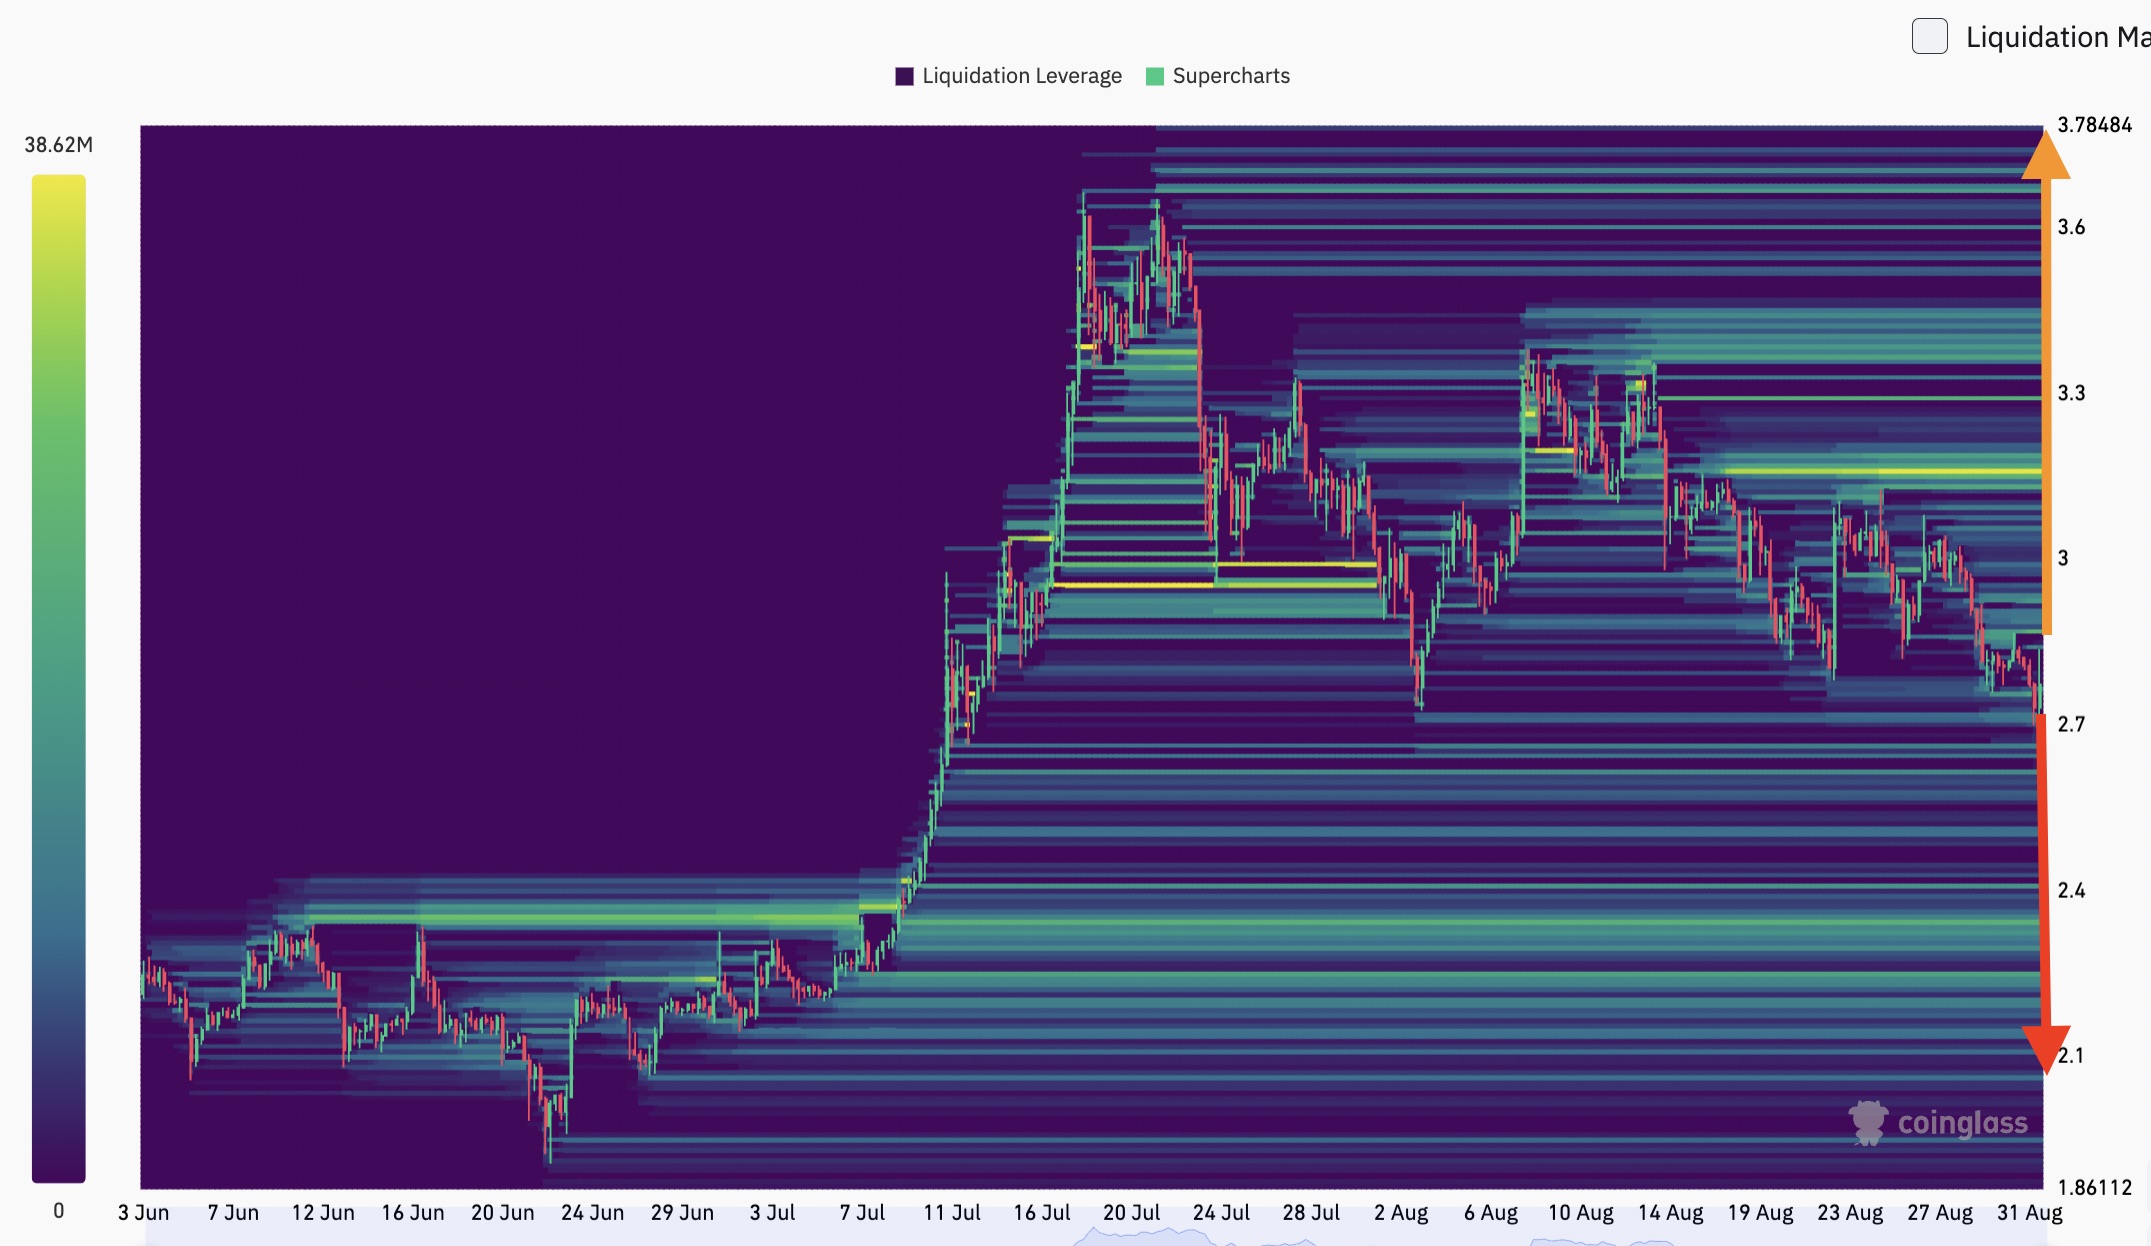
However, there’s also a potential for a bullish reversal. Holding the $2.70 support is vital. If successful, the price could target the upper trendline at $3.09, coinciding with the 50-day SMA and the 0.618 Fibonacci retracement level. A successful breakout could then trigger a rally, potentially pushing towards the apex of the prevailing chart pattern, around $3.70.
The liquidation heatmap shows a concentration of buyers at the $2.70 level, potentially mitigating the risk of a breakdown. Additionally, large ask orders between $2.87 and $3.74 indicate potential resistance levels on the upside.
Looking Ahead
XRP’s future remains uncertain, dependent on several critical factors. A breakdown of the $2.70 support could trigger substantial losses, while a successful defense could propel the price upward. Investors should carefully monitor on-chain metrics, open interest, and key support and resistance levels to gauge XRP’s potential direction. The market will ultimately determine whether XRP can maintain its current position, or succumb to further downward pressure.