

XRP‘s Bearish Outlook: A Deeper Dive
The cryptocurrency XRP is currently facing a confluence of bearish indicators that suggest a potential price correction. Several on-chain and technical signals are flashing warnings, leading analysts to question the sustainability of its current price levels. This article delves into the specifics, examining the key factors contributing to this negative sentiment.
Open Interest and Funding Rates: The Bear’s Grip Tightens
One of the primary concerns for XRP holders stems from the declining open interest (OI) in XRP futures contracts. Data indicates a significant drop in OI, suggesting that investors are actively closing their positions, possibly anticipating a price decline. Historically, decreasing OI has often preceded downward price movements, as it reflects a decrease in capital and enthusiasm to fuel upward momentum. The recent 36% drop in OI since mid-May mirrors a similar pattern observed earlier this year, where a substantial OI decline preceded a notable price drop.
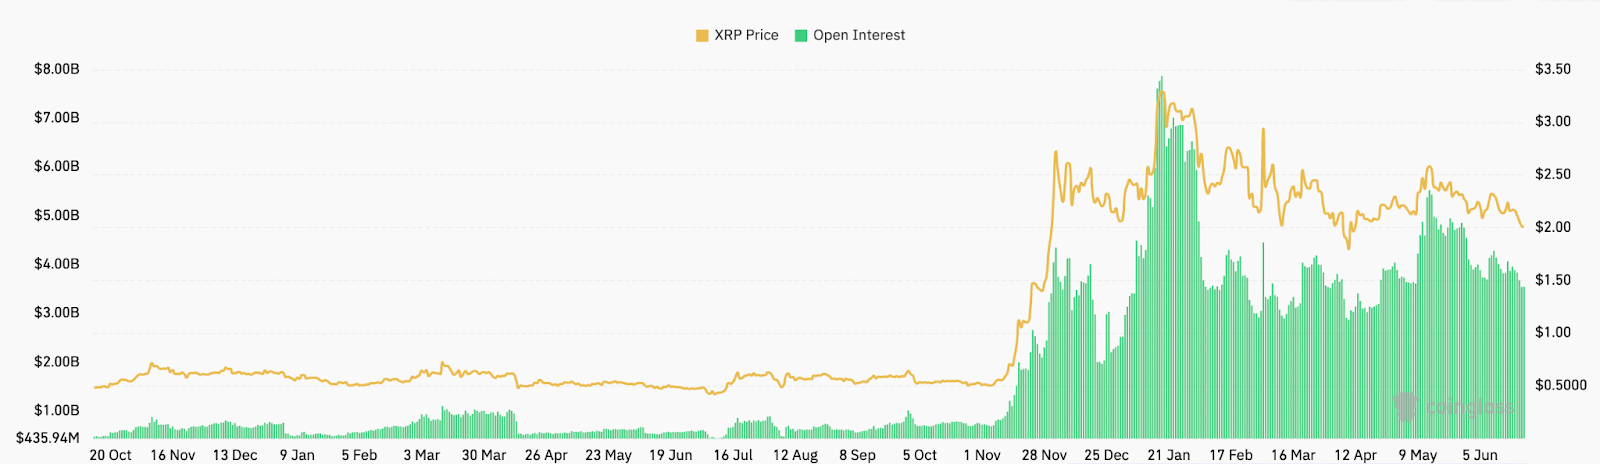
Furthermore, XRP funding rates have turned negative. Funding rates are a mechanism used by perpetual futures exchanges to ensure that the price of a perpetual contract stays close to the spot price. Negative funding rates indicate that short positions are paying long positions, reflecting a prevailing bearish sentiment in the market. This shift provides further evidence of growing pessimism surrounding XRP‘s short-term prospects.

Descending Triangle Pattern and Price Targets
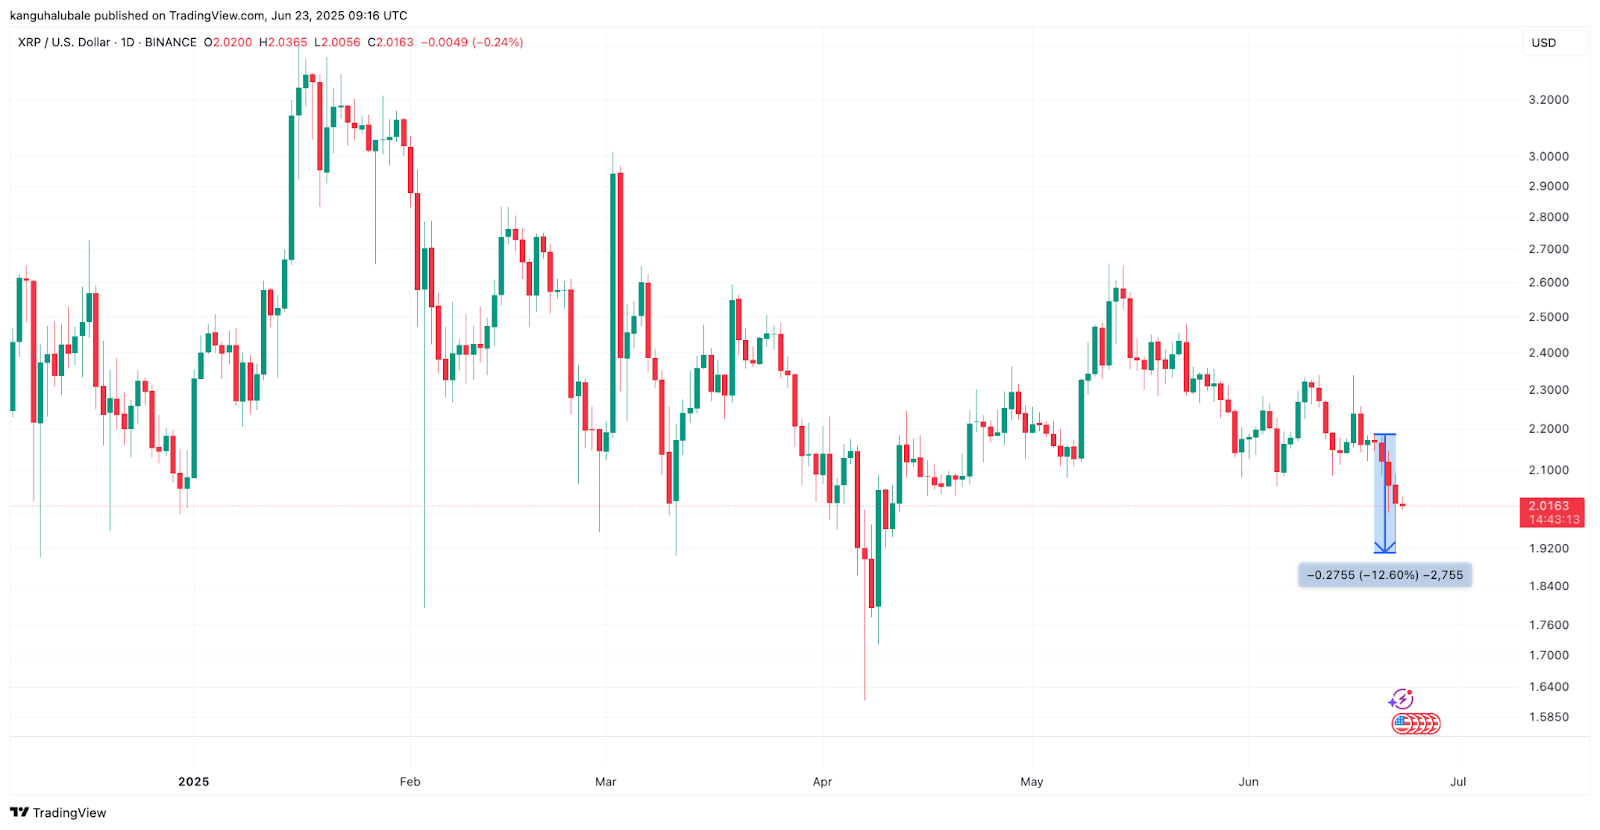
Adding to the bearish narrative is the formation of a descending triangle pattern on XRP‘s daily chart. This pattern, often considered a bearish reversal signal, is characterized by a flat support level and a descending resistance line. The prevailing chart pattern suggests a potential breakdown below the support level, which could trigger a significant price drop. The target price derived from this pattern falls around $1.18, representing a substantial decline from current levels.
Liquidation Levels and Market Dynamics
The Binance XRP/USDT liquidation heatmap provides additional insights into potential price movements. Liquidation heatmaps visualize areas where large liquidation events may occur, acting as magnets for price action. The heatmap reveals significant liquidity zones at $1.75 and $1.60. A break below $1.75 could trigger a cascade of liquidations, driving the price lower towards the subsequent support level at $1.60. This dynamic highlights the potential for rapid price volatility.

Navigating the Uncertainty
The combination of declining open interest, negative funding rates, and a bearish chart pattern paints a concerning picture for XRP‘s short-term outlook. While the descending triangle pattern could be invalidated if the price breaks above the resistance line, the prevailing technical and on-chain indicators point towards a potential price correction. Investors should closely monitor key support and resistance levels, manage risk effectively, and conduct thorough research before making any investment decisions.