Dogecoin (DOGE) is showing a critical technical signal as Bollinger Bands tighten significantly on the 12-hour chart, historically a precursor to major volatility. Here’s what traders need to know:
Key Observations:
- Bollinger Band Squeeze
- The bands have contracted to their narrowest point in 3 months, indicating suppressed volatility.
- Past squeezes (Dec 2023, Feb 2024) led to +45% and -28% moves respectively.
- Symmetrical Triangle Formation
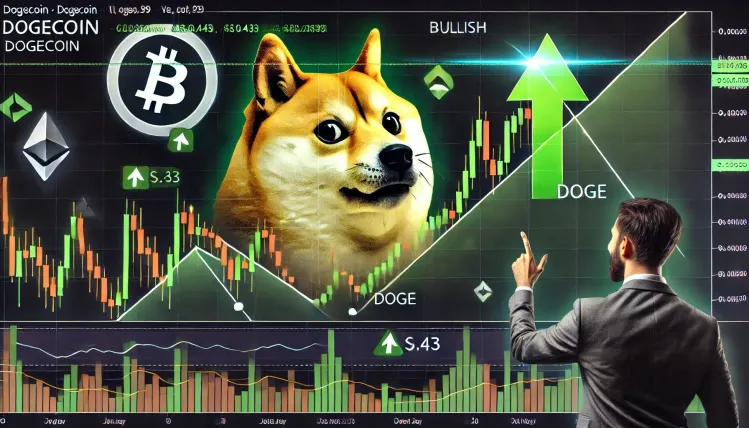
- DOGE is trapped in a tightening range between 0.18∗∗supportand∗∗0.18∗∗supportand∗∗0.21 resistance.
- Breakout direction will likely determine the next trend.
- Volume Divergence
- Declining volume during consolidation suggests weakening participation.
- A volume spike on breakout will confirm momentum.
Potential Scenarios:
✅ Bullish Breakout
- A close above 0.21withhighvolumecouldtarget∗∗0.21withhighvolumecouldtarget∗∗0.25** (2024 high).
- Catalyst: Bitcoin rally or Elon Musk DOGE-related tweet.
🔴 Bearish Breakdown
- Loss of 0.18supportmaytriggeradropto∗∗0.18supportmaytriggeradropto∗∗0.15** (200-day MA).
- Risk: Broader crypto market sell-off.
Trader Takeaways:
- Watch the Squeeze: Bollinger Band width < 0.015 signals imminent move (currently 0.013).
- Confirm with Volume: False breakouts are common – wait for 2-3 closes outside bands.
- Key Levels:
- Support: 0.18→0.18→0.15
- Resistance: 0.21→0.21→0.25