

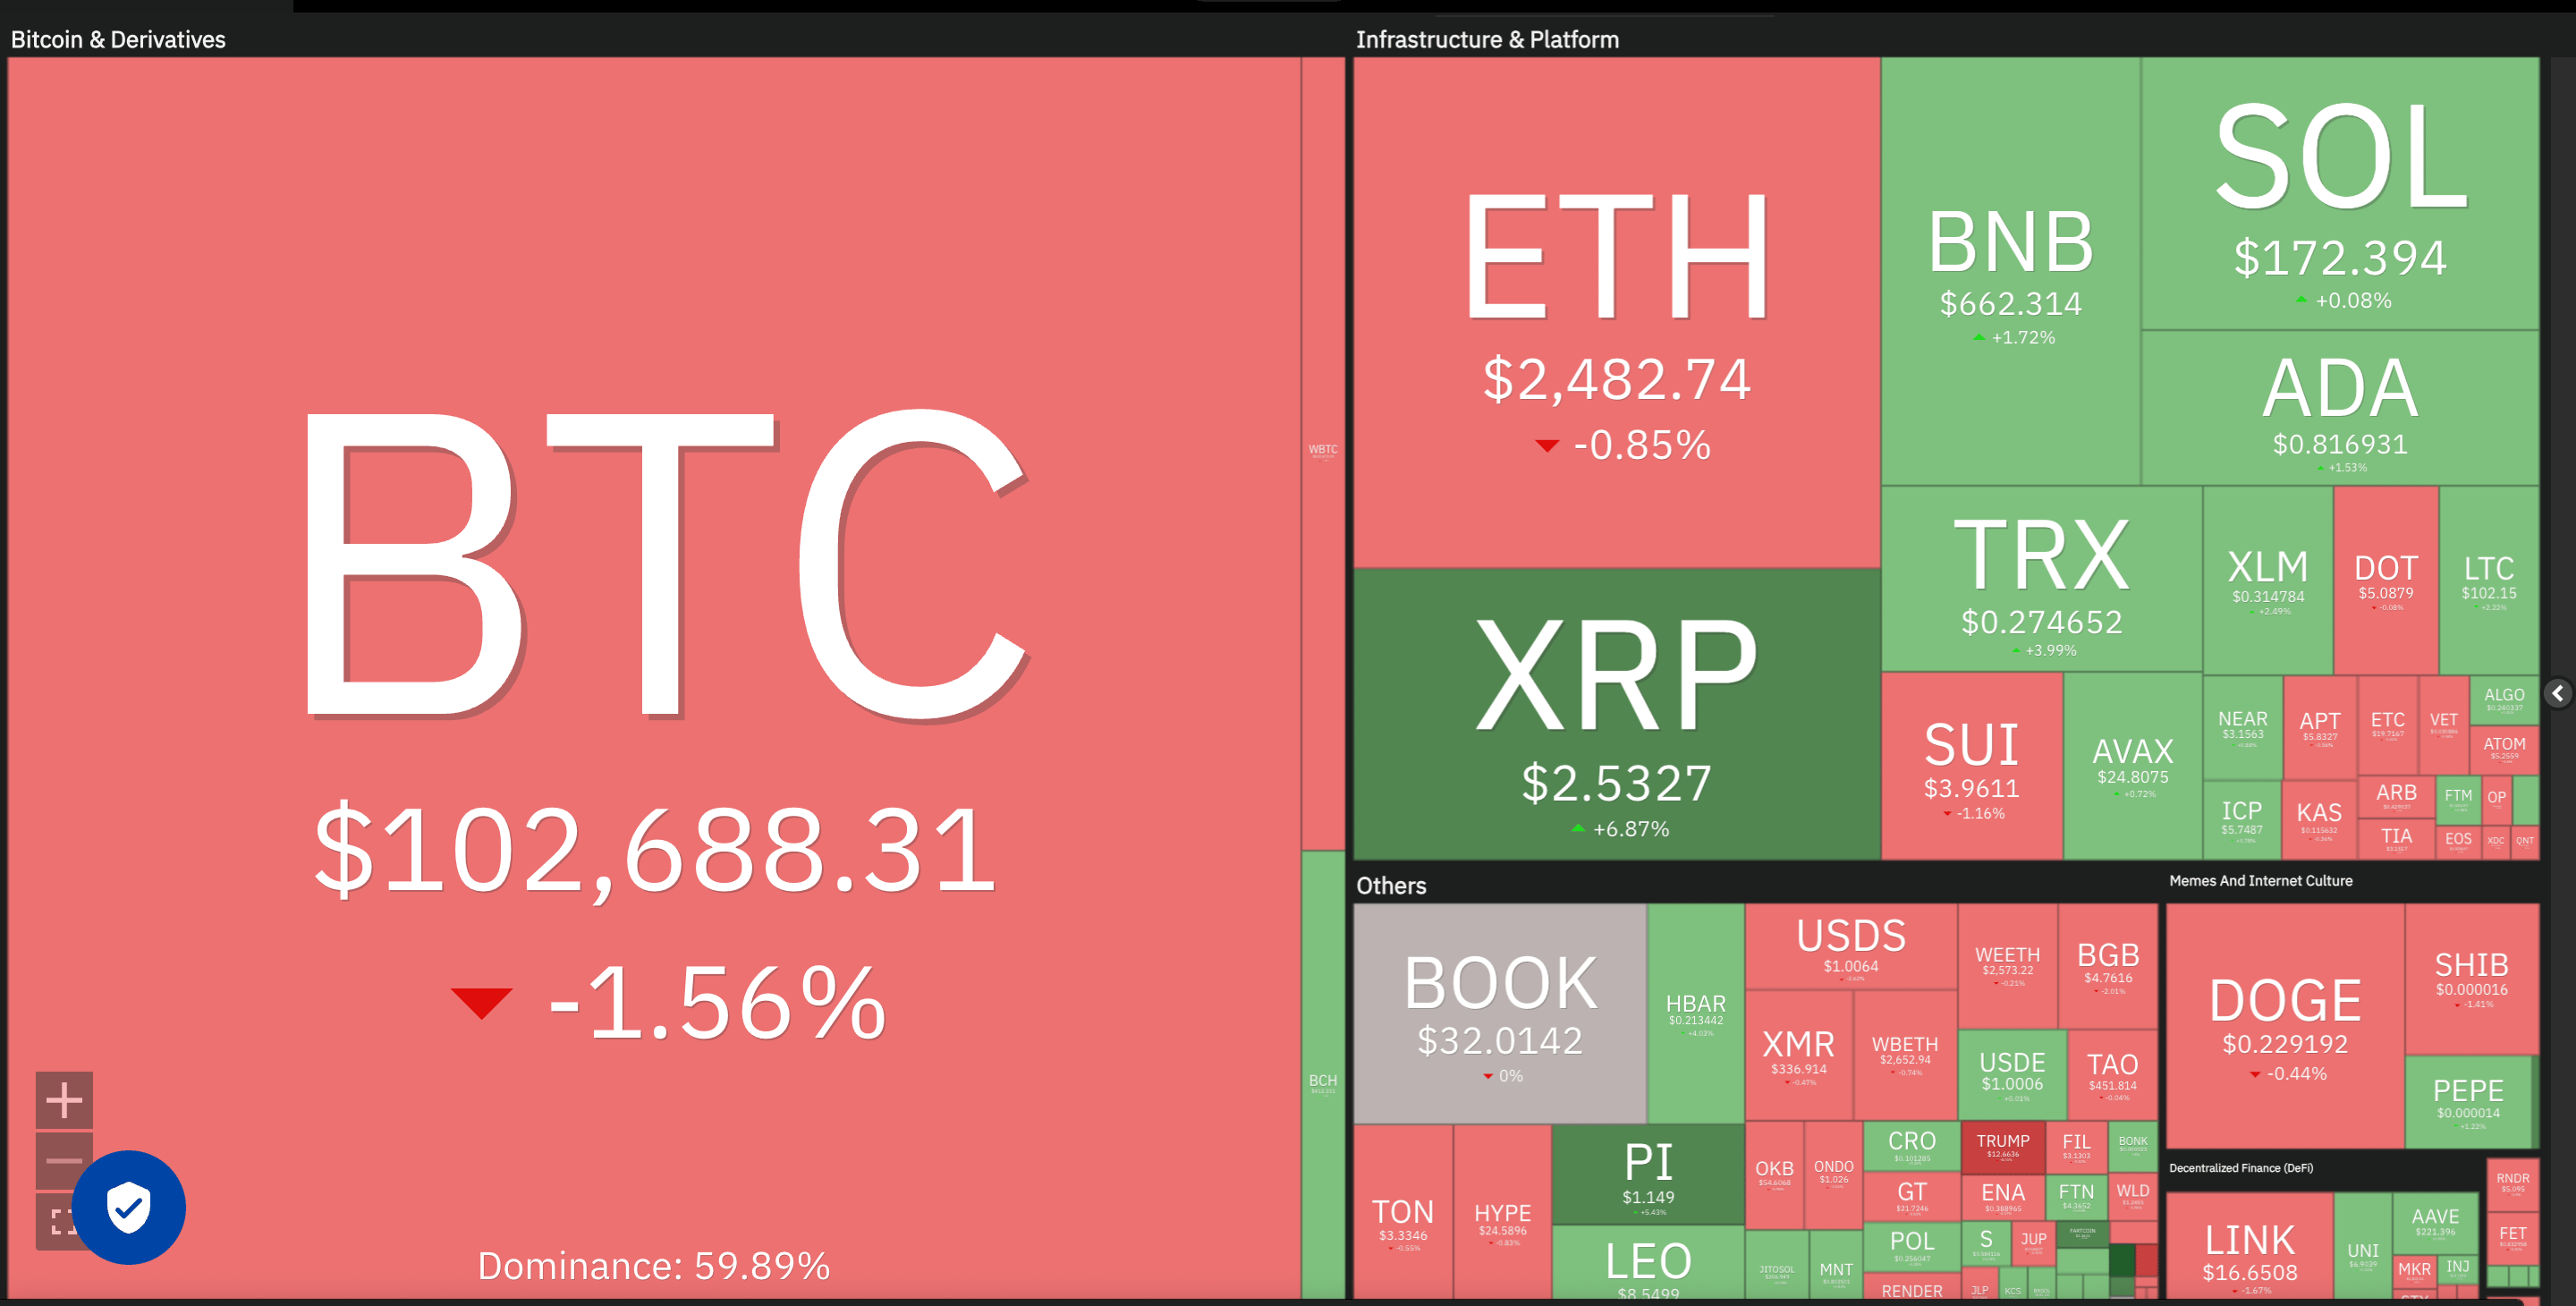
Bitcoin Takes a Pause Amidst a Shifting Market
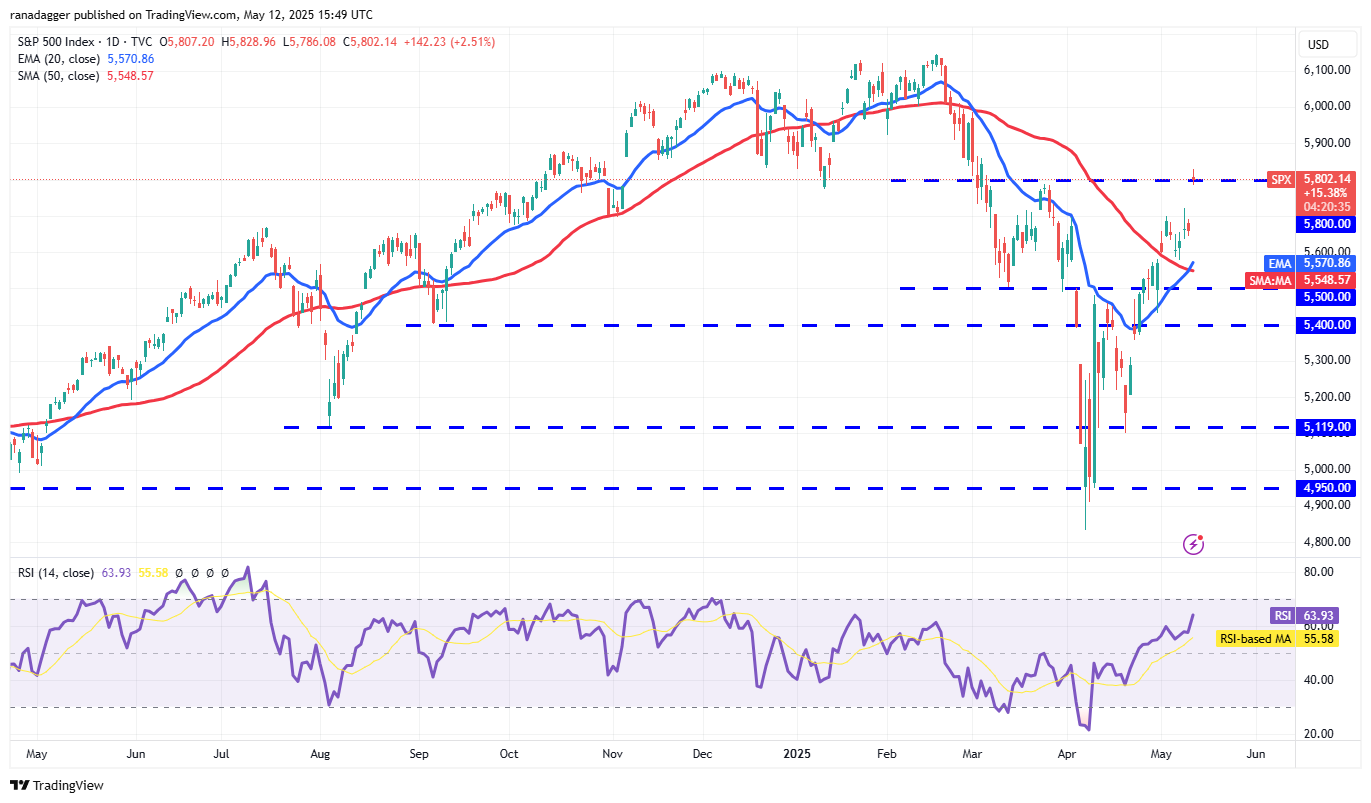
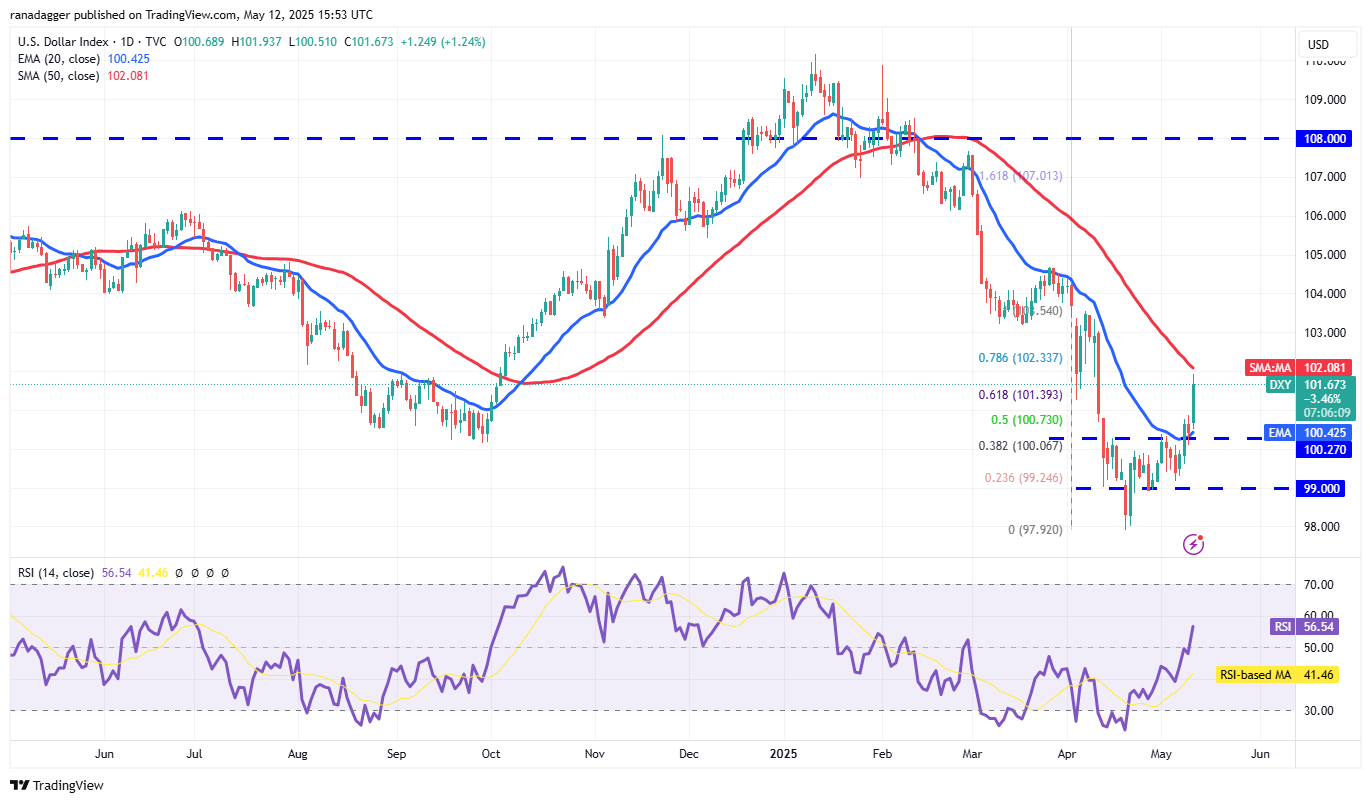
Bitcoin (BTC) opened the new week on a cautious note, falling below $103,000. The S&P 500 Index (SPX) and the US Dollar Index (DXY) rose sharply in response to the announced US-China trade agreement. Some market analysts suggest that other assets are trying to catch up with Bitcoin, while the strengthening dollar may be acting as a headwind for Bitcoin in the short term.
Despite the short-term uncertainty, long-term bulls remain confident in Bitcoin’s future. Michael Saylor’s Strategy recently acquired 13,390 Bitcoin at an average price of $99,856, bringing their total Bitcoin holdings to a staggering 568,840 BTC.
Key Support Levels to Watch
Here’s a breakdown of the crucial support levels for Bitcoin and some of the leading altcoins:
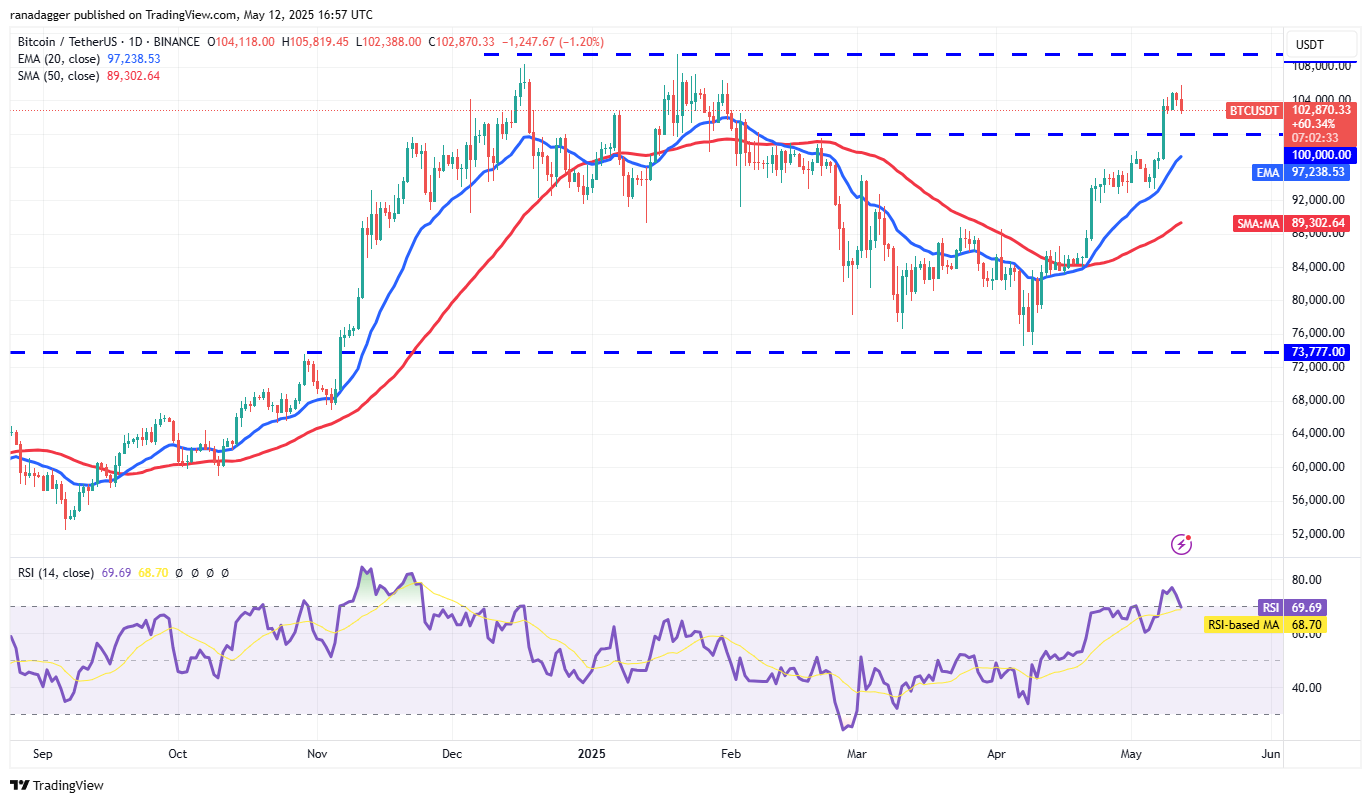
- **Bitcoin (BTC):** The first support level is at $100,000, followed by the 20-day EMA at $97,238. If the price rebounds, the bulls will target $109,588 and possibly even $130,000. However, breaking below the 20-day EMA could lead to a decline towards $93,000 and then to the 50-day SMA at $89,302.
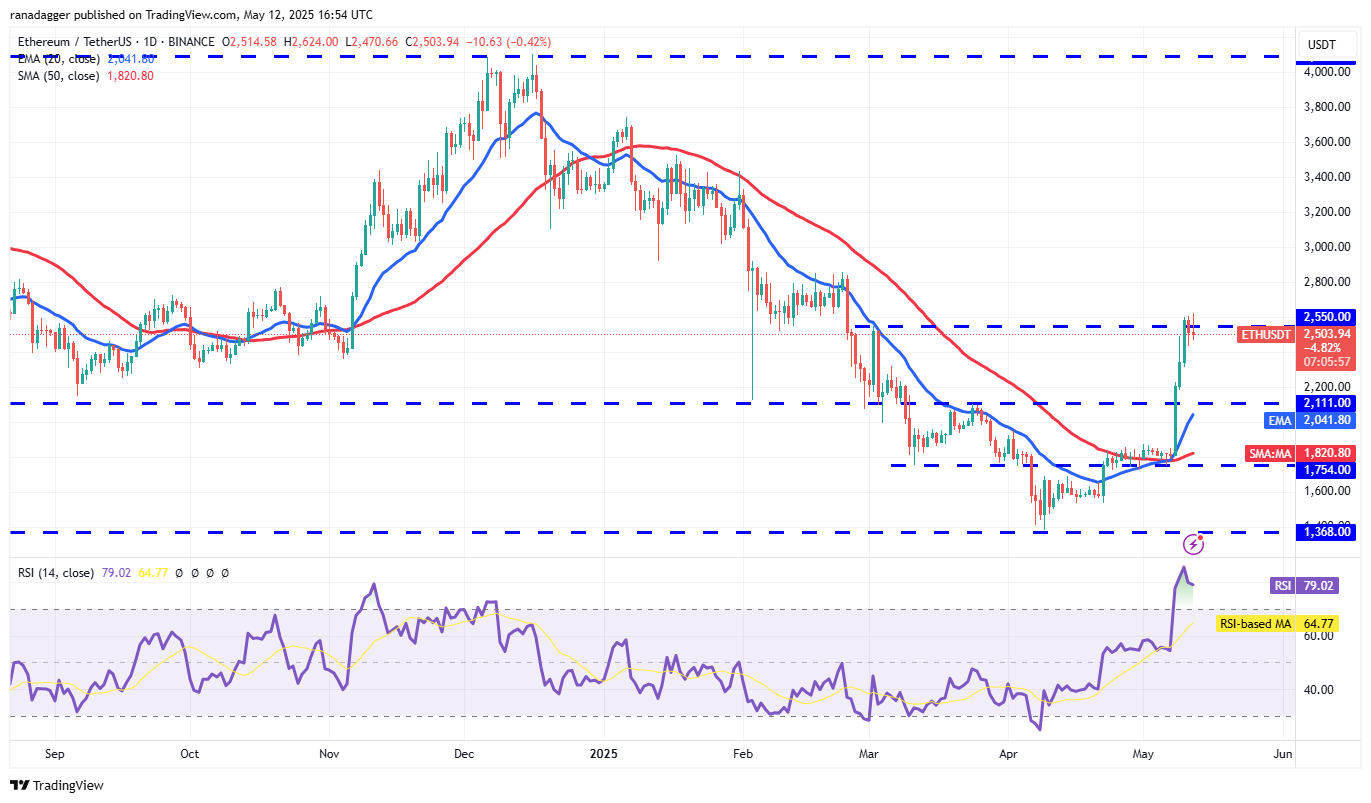
- **Ether (ETH):** Bulls are attempting to maintain the price above $2,550, but selling pressure remains. A drop below $2,435 could push the price to $2,320. A rebound from this level would signal a potential return to the uptrend, with resistance at $2,850 and a possible target of $3,000. However, breaking below $2,320 could lead to a decline to the breakout level of $2,111.
- **XRP (XRP):** XRP broke above resistance on May 10 and successfully held the retest of the breakout level on May 11. Bulls have strengthened their position above the $2.50 resistance, with minor resistance at $2.65. If this level is crossed, a rally to $3 is possible, signaling a potential trend change. However, a sharp decline from $2.65 and a break below the 20-day EMA at $2.27 could indicate a range formation between $2 and $2.65.
- **BNB (BNB):** BNB rebounded off the breakout level of $644 on May 12. The bulls will attempt to push the price towards $745 if it remains above $644. A break below $644 would weaken the bulls, potentially leading to a decline to the 20-day EMA at $621.
- **Solana (SOL):** The uptrend has stalled near the $180 resistance, but a shallow pullback could still result in a continuation of the rally. If buyers drive the price above $180, a rally to $210 is possible. Immediate support is at $168, with a potential decline to the 20-day EMA at $155 if it breaks below. A break below $153 would signal a loss of momentum for the bulls.
- **Dogecoin (DOGE):** Dogecoin turned down from $0.26 on May 11, indicating profit-taking by short-term buyers. Bulls are expected to defend the breakout level of $0.21. A strong rebound from $0.21 would confirm its transformation into support, potentially leading to a climb towards $0.31. However, a break and close below $0.21 would suggest that bears remain active at higher levels, potentially leading to a decline towards the moving averages, forming a range between $0.14 and $0.26.
- **Cardano (ADA):** Cardano faces resistance near $0.86, but the bulls have held their ground. The 20-day EMA at $0.72 is turning up, and the RSI is near the overbought zone, favoring buyers. A rebound from the neckline could lead to a push above $0.856, targeting $1.01. However, a swift decline below the moving averages could result in a drop to the solid support at $0.58.
- **Sui (SUI):** Sui is facing selling pressure at $4.25, but the price remains above the breakout level of $3.90. Both moving averages are sloping up, and the RSI is near the overbought zone, suggesting an upside bias. If buyers overcome the $4.25 resistance, a surge to $5 is possible. A break and close below $3.90 would weaken the bulls, potentially leading to a decline towards the 20-day EMA at $3.48. A bounce off the 20-day EMA would signal the persistence of positive momentum, allowing the bulls to challenge the $4.25 resistance again.
Market Dynamics and Implications
The recent price action in Bitcoin and the broader cryptocurrency market highlights the complex interplay of factors influencing the crypto landscape. The US-China trade deal, while positive for global economic growth, has also led to a surge in the US Dollar Index, potentially creating headwinds for Bitcoin in the short term. The strong performance of select altcoins like XRP, BNB, and SUI suggests that investors are seeking opportunities beyond Bitcoin. While the current market uncertainty adds a layer of complexity, the overall outlook remains positive for the long term, as evidenced by the continued accumulation of Bitcoin by institutional investors like Michael Saylor’s Strategy.
This analysis does not constitute investment advice. All investment and trading moves involve risk, and readers should conduct their own research before making any decisions.