Bitcoin’s Bullish Momentum
Bitcoin’s (BTC) decisive break above the psychologically significant $100,000 mark on May 8th has sent shockwaves through the crypto market. This rally, resulting in a staggering $837.80 million in short liquidations in a 24-hour period, has ignited a wave of optimism among bulls. While the immediate short-term picture appears positive, a few key factors will determine whether this momentum can sustain.
The BTC/USDT pair has set its sights on the $107,000 to $109,588 zone, a region where bears are expected to mount a robust defense. Despite the current bullish sentiment, the overbought level on the Relative Strength Index (RSI) suggests a potential short-term pullback is on the horizon. Maintaining the price above the 20-day Exponential Moving Average ($94,879) during any pullbacks will be crucial for preserving bullish momentum.
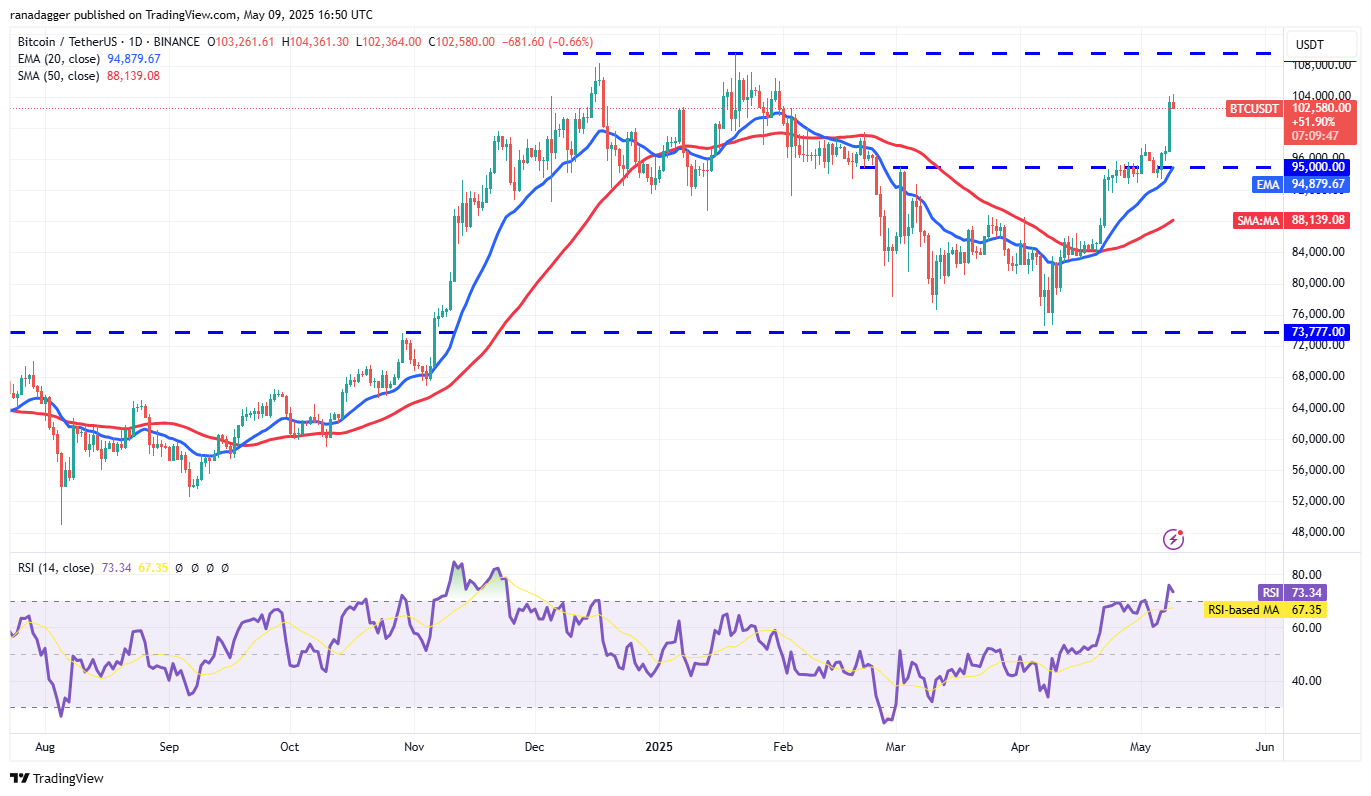
A close below the 20-day EMA would be a bearish signal, indicating potential profit-taking at higher levels. This could lead to a decline towards the 50-day Simple Moving Average ($88,139).
Altcoins Riding the Wave
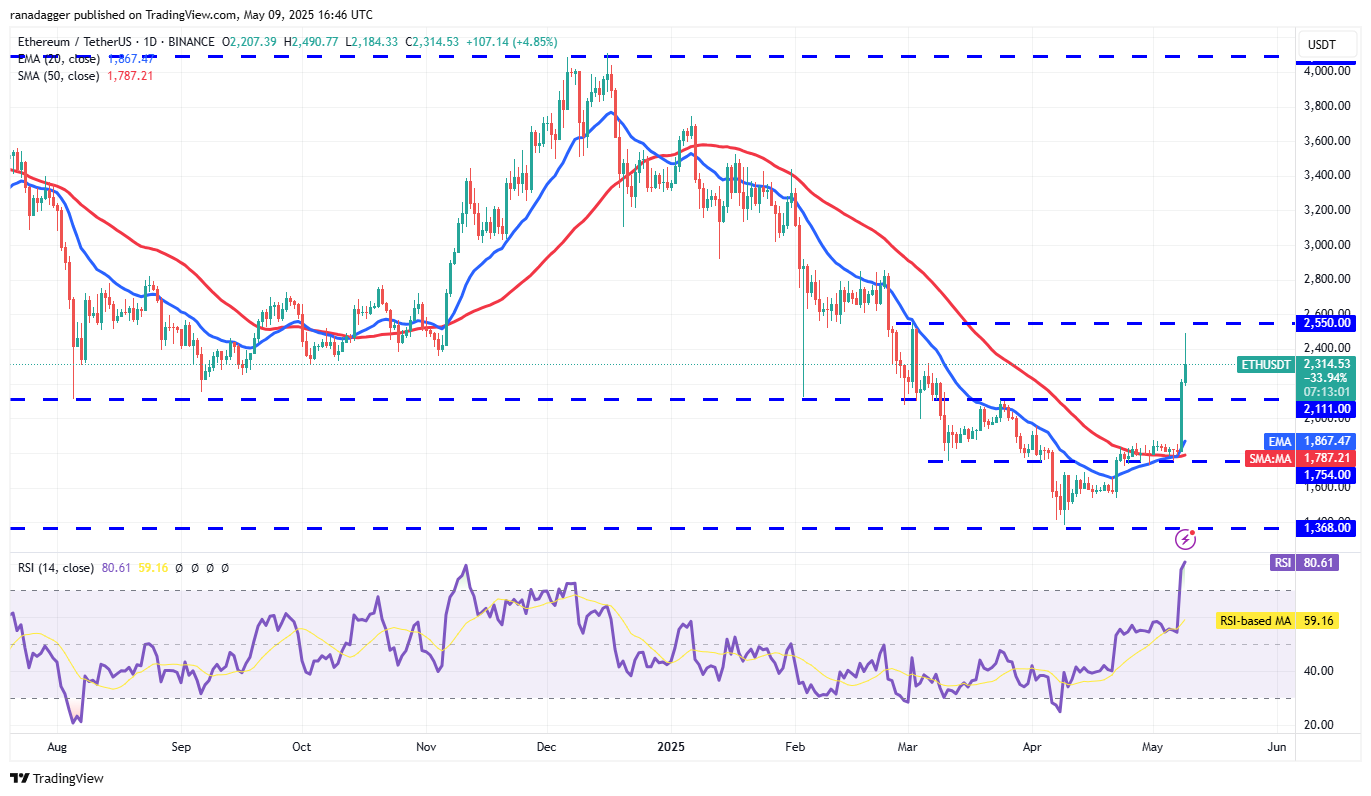
Bitcoin’s rally has not only boosted the flagship cryptocurrency but has also lifted several major altcoins. Ether (ETH) spearheaded this altcoin surge, soaring approximately 22% on May 8th and triggering $328 million in liquidations of Ether short positions. The ETH/USDT pair is now aiming for the $2,850 mark. However, a strong defense by sellers around the $2,550 level could result in a pullback. Support at $2,111 will be a crucial level to watch, and a break below could send ETH towards the 20-day EMA ($1,867).
The ETH/USDT pair is now aiming for the $2,850 mark. However, a strong defense by sellers around the $2,550 level could result in a pullback. Support at $2,111 will be a crucial level to watch, and a break below could send ETH towards the 20-day EMA ($1,867).
- XRP: XRP (XRP) is facing a crucial resistance line that could determine its short-term trajectory. A break and close above this line would signal a potential trend change, potentially driving the XRP/USDT pair towards $2.60 and eventually $3. Support at the moving averages would be a positive sign for buyers.
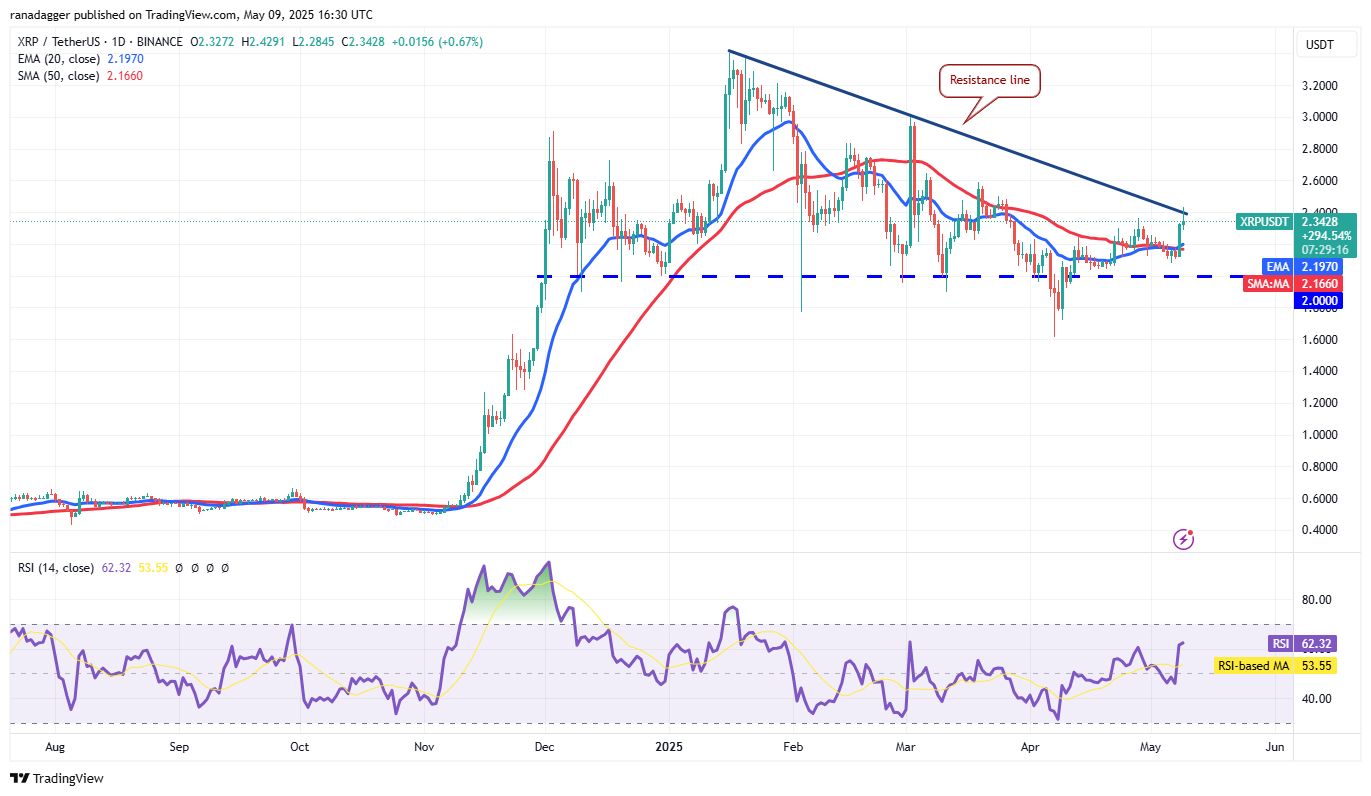
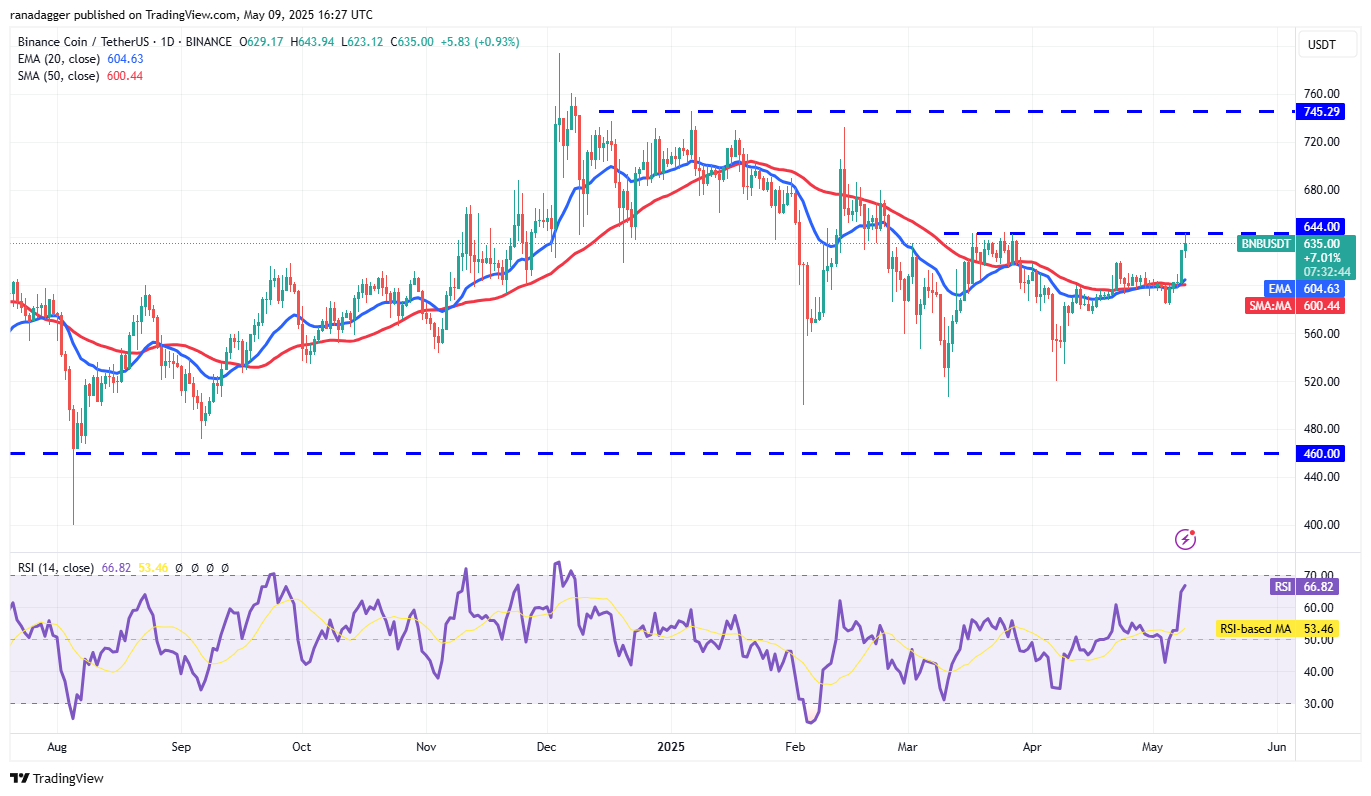
XRP/USDT daily chart. Source: Cointelegraph/TradingView - BNB: BNB (BNB) surged above the immediate overhead resistance at $620, reaching the $644 level on May 9th. If buyers maintain their pressure and push past $644, a rally towards $680 could be in store. The bears will need to defend $644 fiercely to halt the uptrend and potentially push the price below the moving averages.
- SOL: Solana (SOL) broke and closed above the $153 resistance, confirming bullish momentum. The SOL/USDT pair could reach $180, but a pullback from this level with support at $153 would suggest buyers are forming a higher low, increasing the likelihood of a rally to $200.
- DOGE: Dogecoin (DOGE) managed to defend its moving averages and reached the $0.21 resistance. A break above could propel the DOGE/USDT pair toward $0.25, and support at $0.21 would indicate a potential shift in sentiment. However, a sharp decline below the moving averages could indicate more range-bound trading in the near term.
- ADA: Cardano (ADA) bounced off the 50-day SMA ($0.67) and completed an inverse head-and-shoulders pattern. The uptrend in the 20-day EMA ($0.69) and the positive RSI suggest a bullish advantage. Continued trading above the neckline could drive the ADA/USDT pair towards the pattern target of $1.01. However, a drop below the 50-day SMA could lead to a decline to $0.60 and potentially $0.50.
- SUI: Sui (SUI) rallied strongly from the 20-day EMA ($3.29) and surpassed the $3.90 resistance. Maintaining the price above this level could see the SUI/USDT pair rise to $4.25 and potentially $5. A close below $3.90 suggests a potential bearish comeback, potentially pulling the price back towards the 20-day EMA.
- LINK: Chainlink (LINK) rallied sharply from the 50-day SMA ($13.72) and completed an inverse head-and-shoulders pattern. Sellers are attempting to pull the price back below the neckline. A successful defense of this level could lead to a break above the resistance line and a rally towards the pattern target of $21.30. However, a sharp decline below the moving averages could open the door for a fall to $12.
- AVAX: Avalanche (AVAX) rebounded off the moving averages and reached the overhead resistance of $23.50. A break and close above this level could clear the path for a potential rise to $28.78 and then to $31.73. Conversely, a sharp decline below the moving averages could signal extended range-bound trading.
Disclaimer: This article does not constitute investment advice or recommendations. All investment and trading involve risk, and readers are encouraged to conduct their own research before making any decisions.