XRP‘s Whale Flows Spark a 400% Déjà Vu?
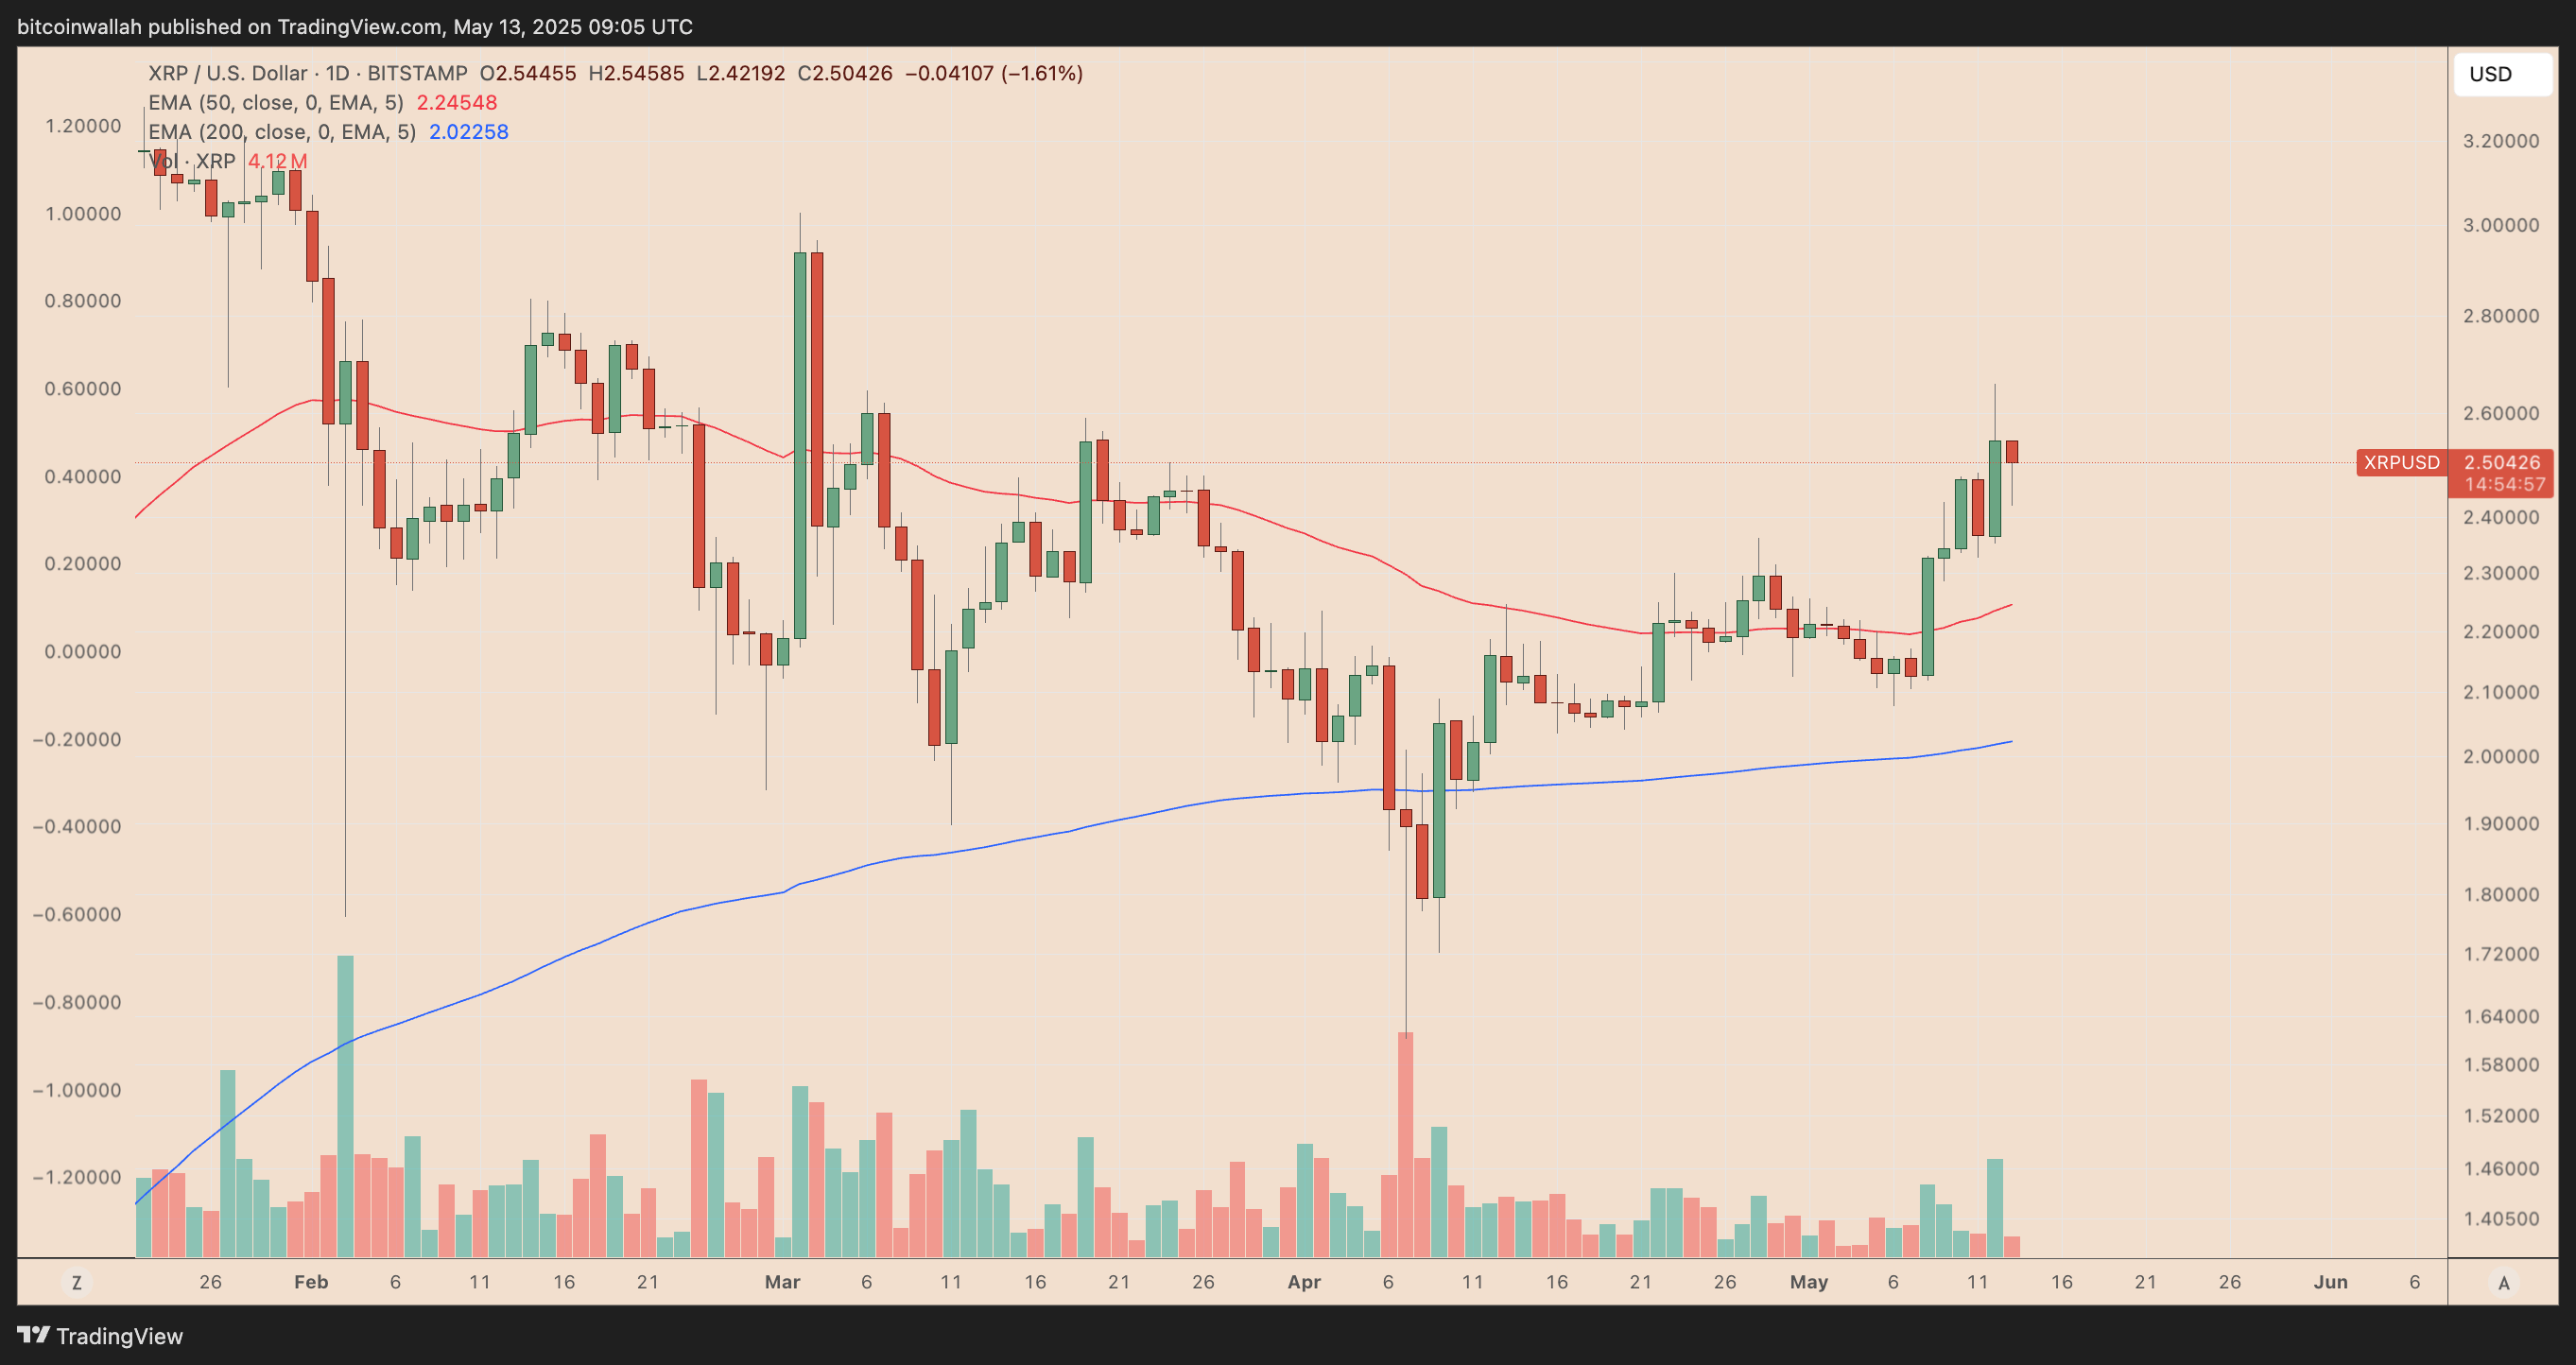
XRP (XRP) has been riding a wave of optimism, surging over 55% since hitting a low point in April. This bullish momentum has caught the attention of analysts who see echoes of past price trends driven by shifts in whale behavior.
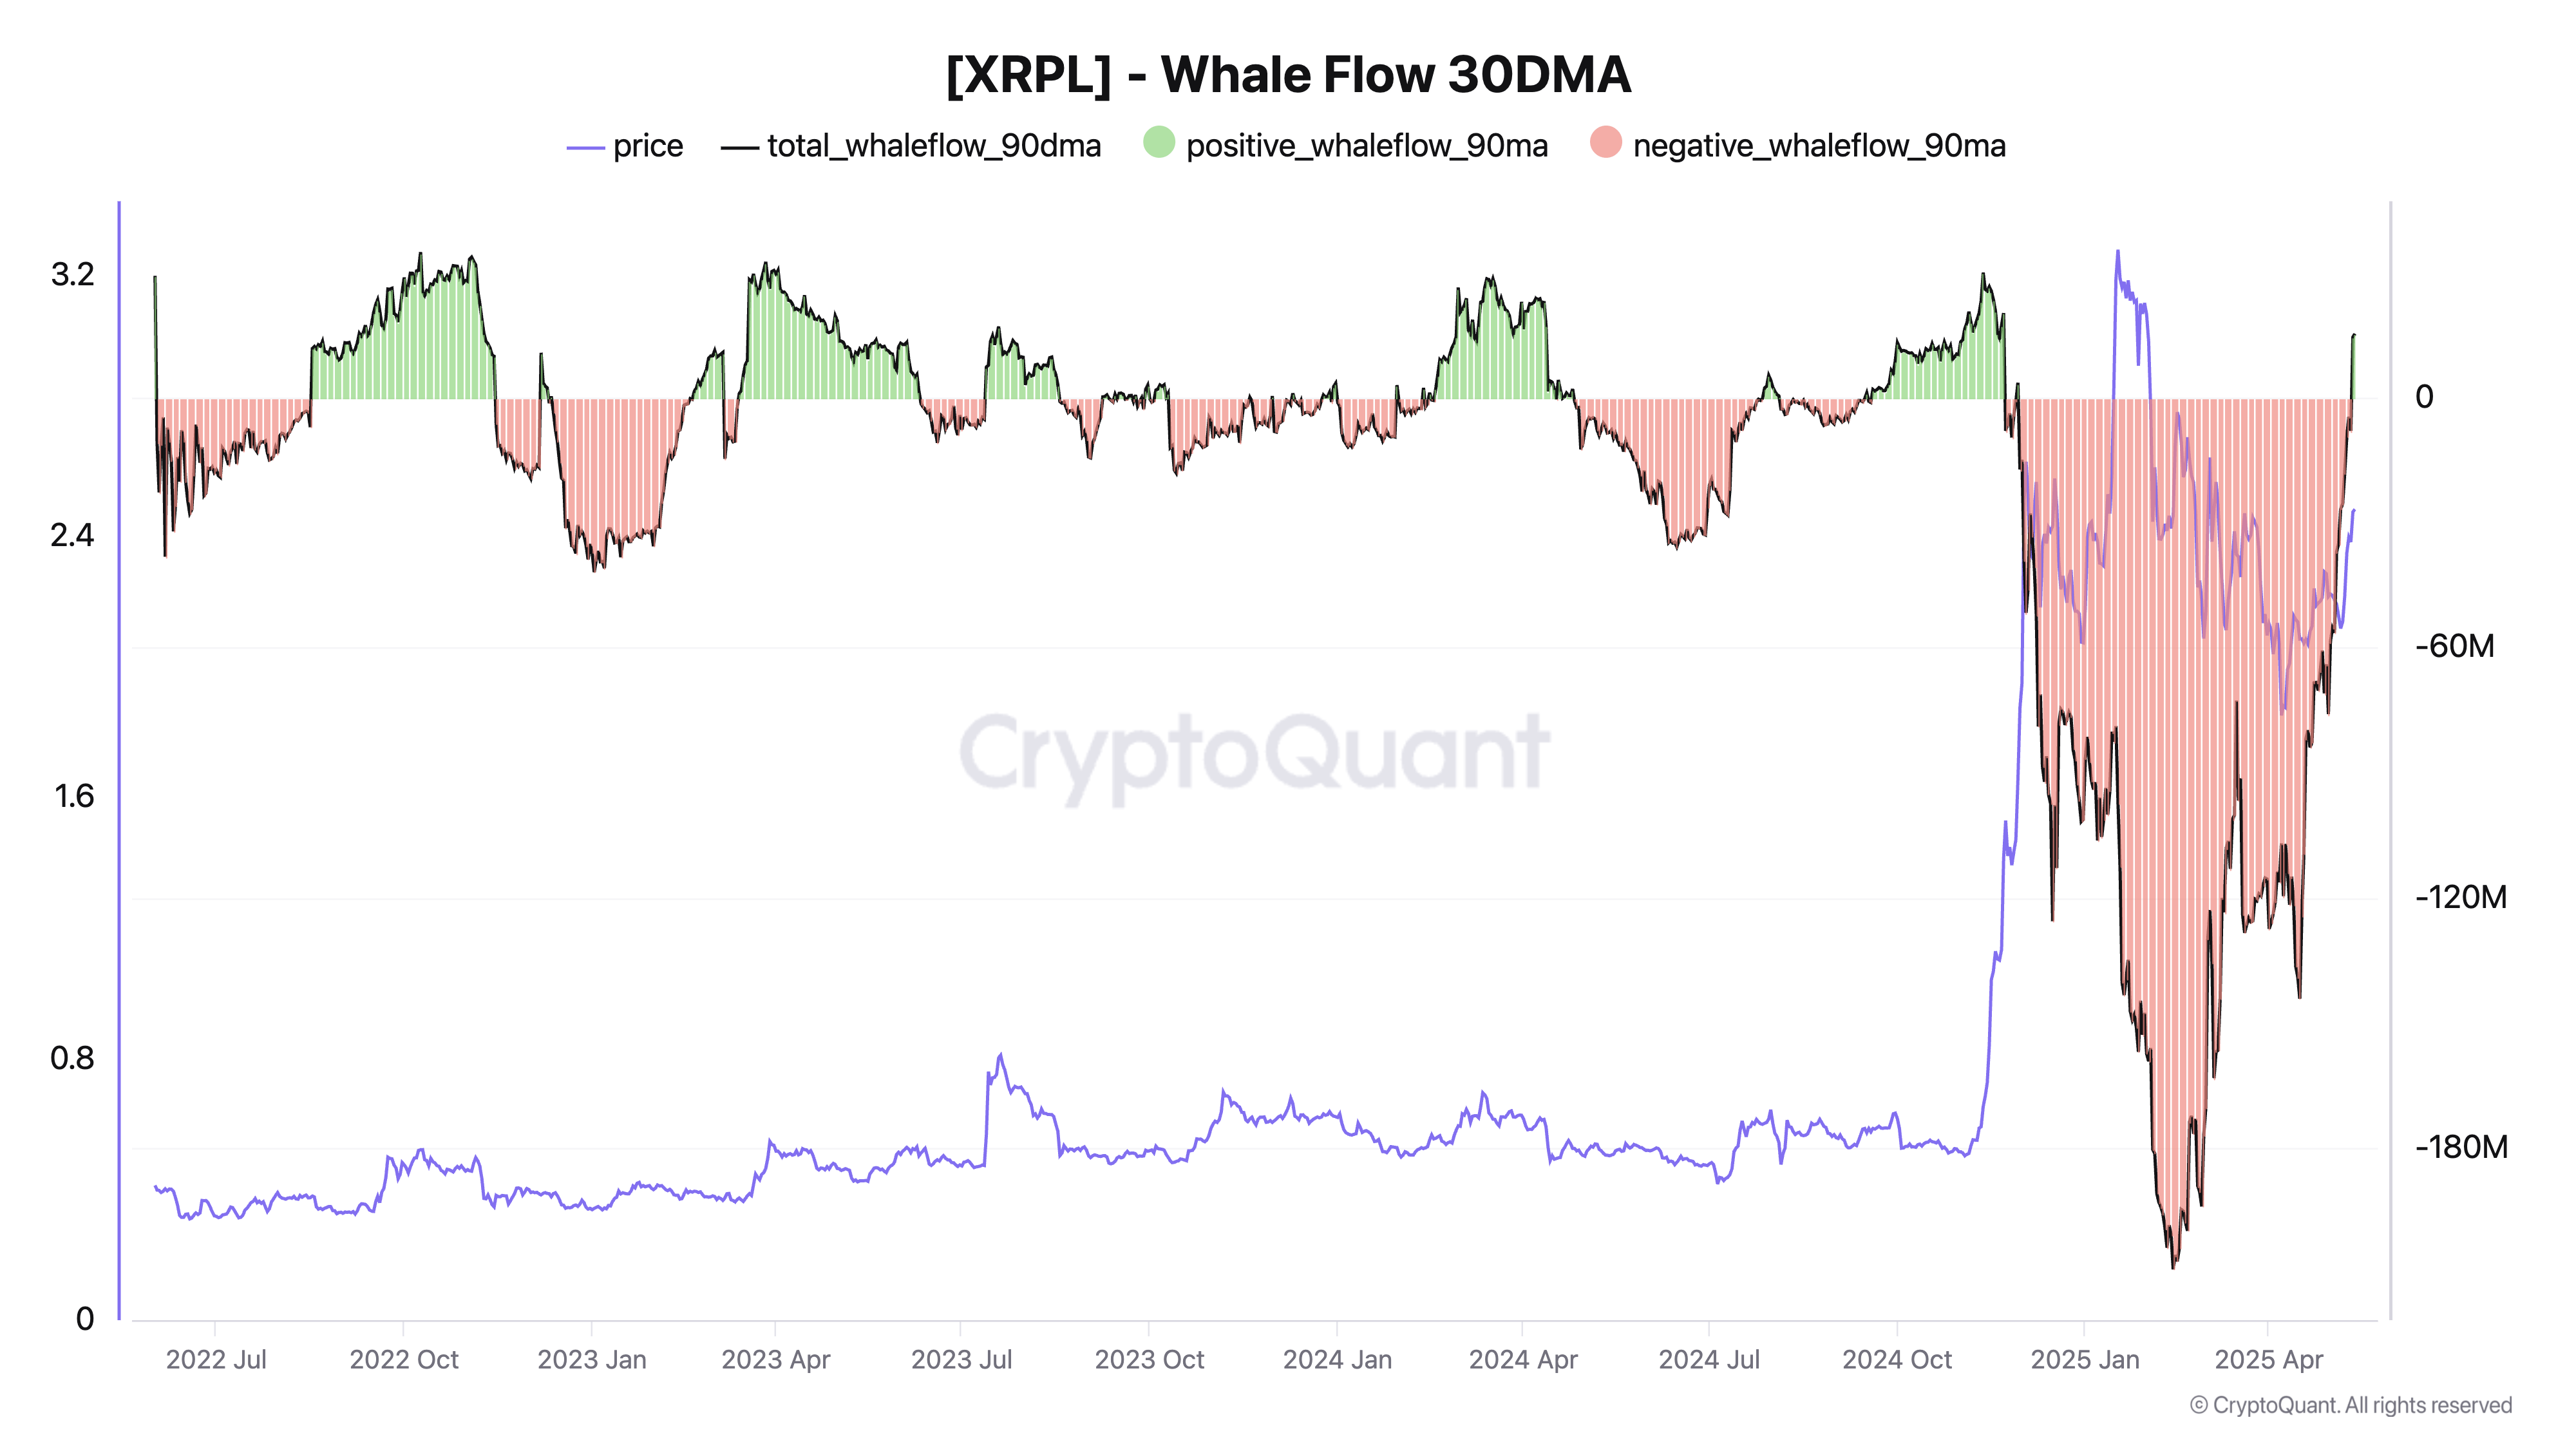
The latest data from CryptoQuant reveals a critical change in whale flows. After a period of sustained selling pressure since November 2024, XRP whales (wallets holding substantial amounts of XRP) are starting to slow down their sell-offs, indicating a potential change in sentiment.
History Repeating?
This pattern of whale flows turning positive after a lengthy period of negative sentiment has a strong precedent in XRP‘s history. In 2024, a similar shift in whale behavior coincided with a dramatic 400% price surge, leading many analysts to believe this could be a harbinger of a similar price rally in the near future.
While the current whale flow reversal isn’t a full-fledged turnaround, it is the first indication of stabilization after months of intense selling pressure. This suggests that a period of accumulation might be underway, setting the stage for a larger price breakout.
Technical Breakout Points to 40% Upside
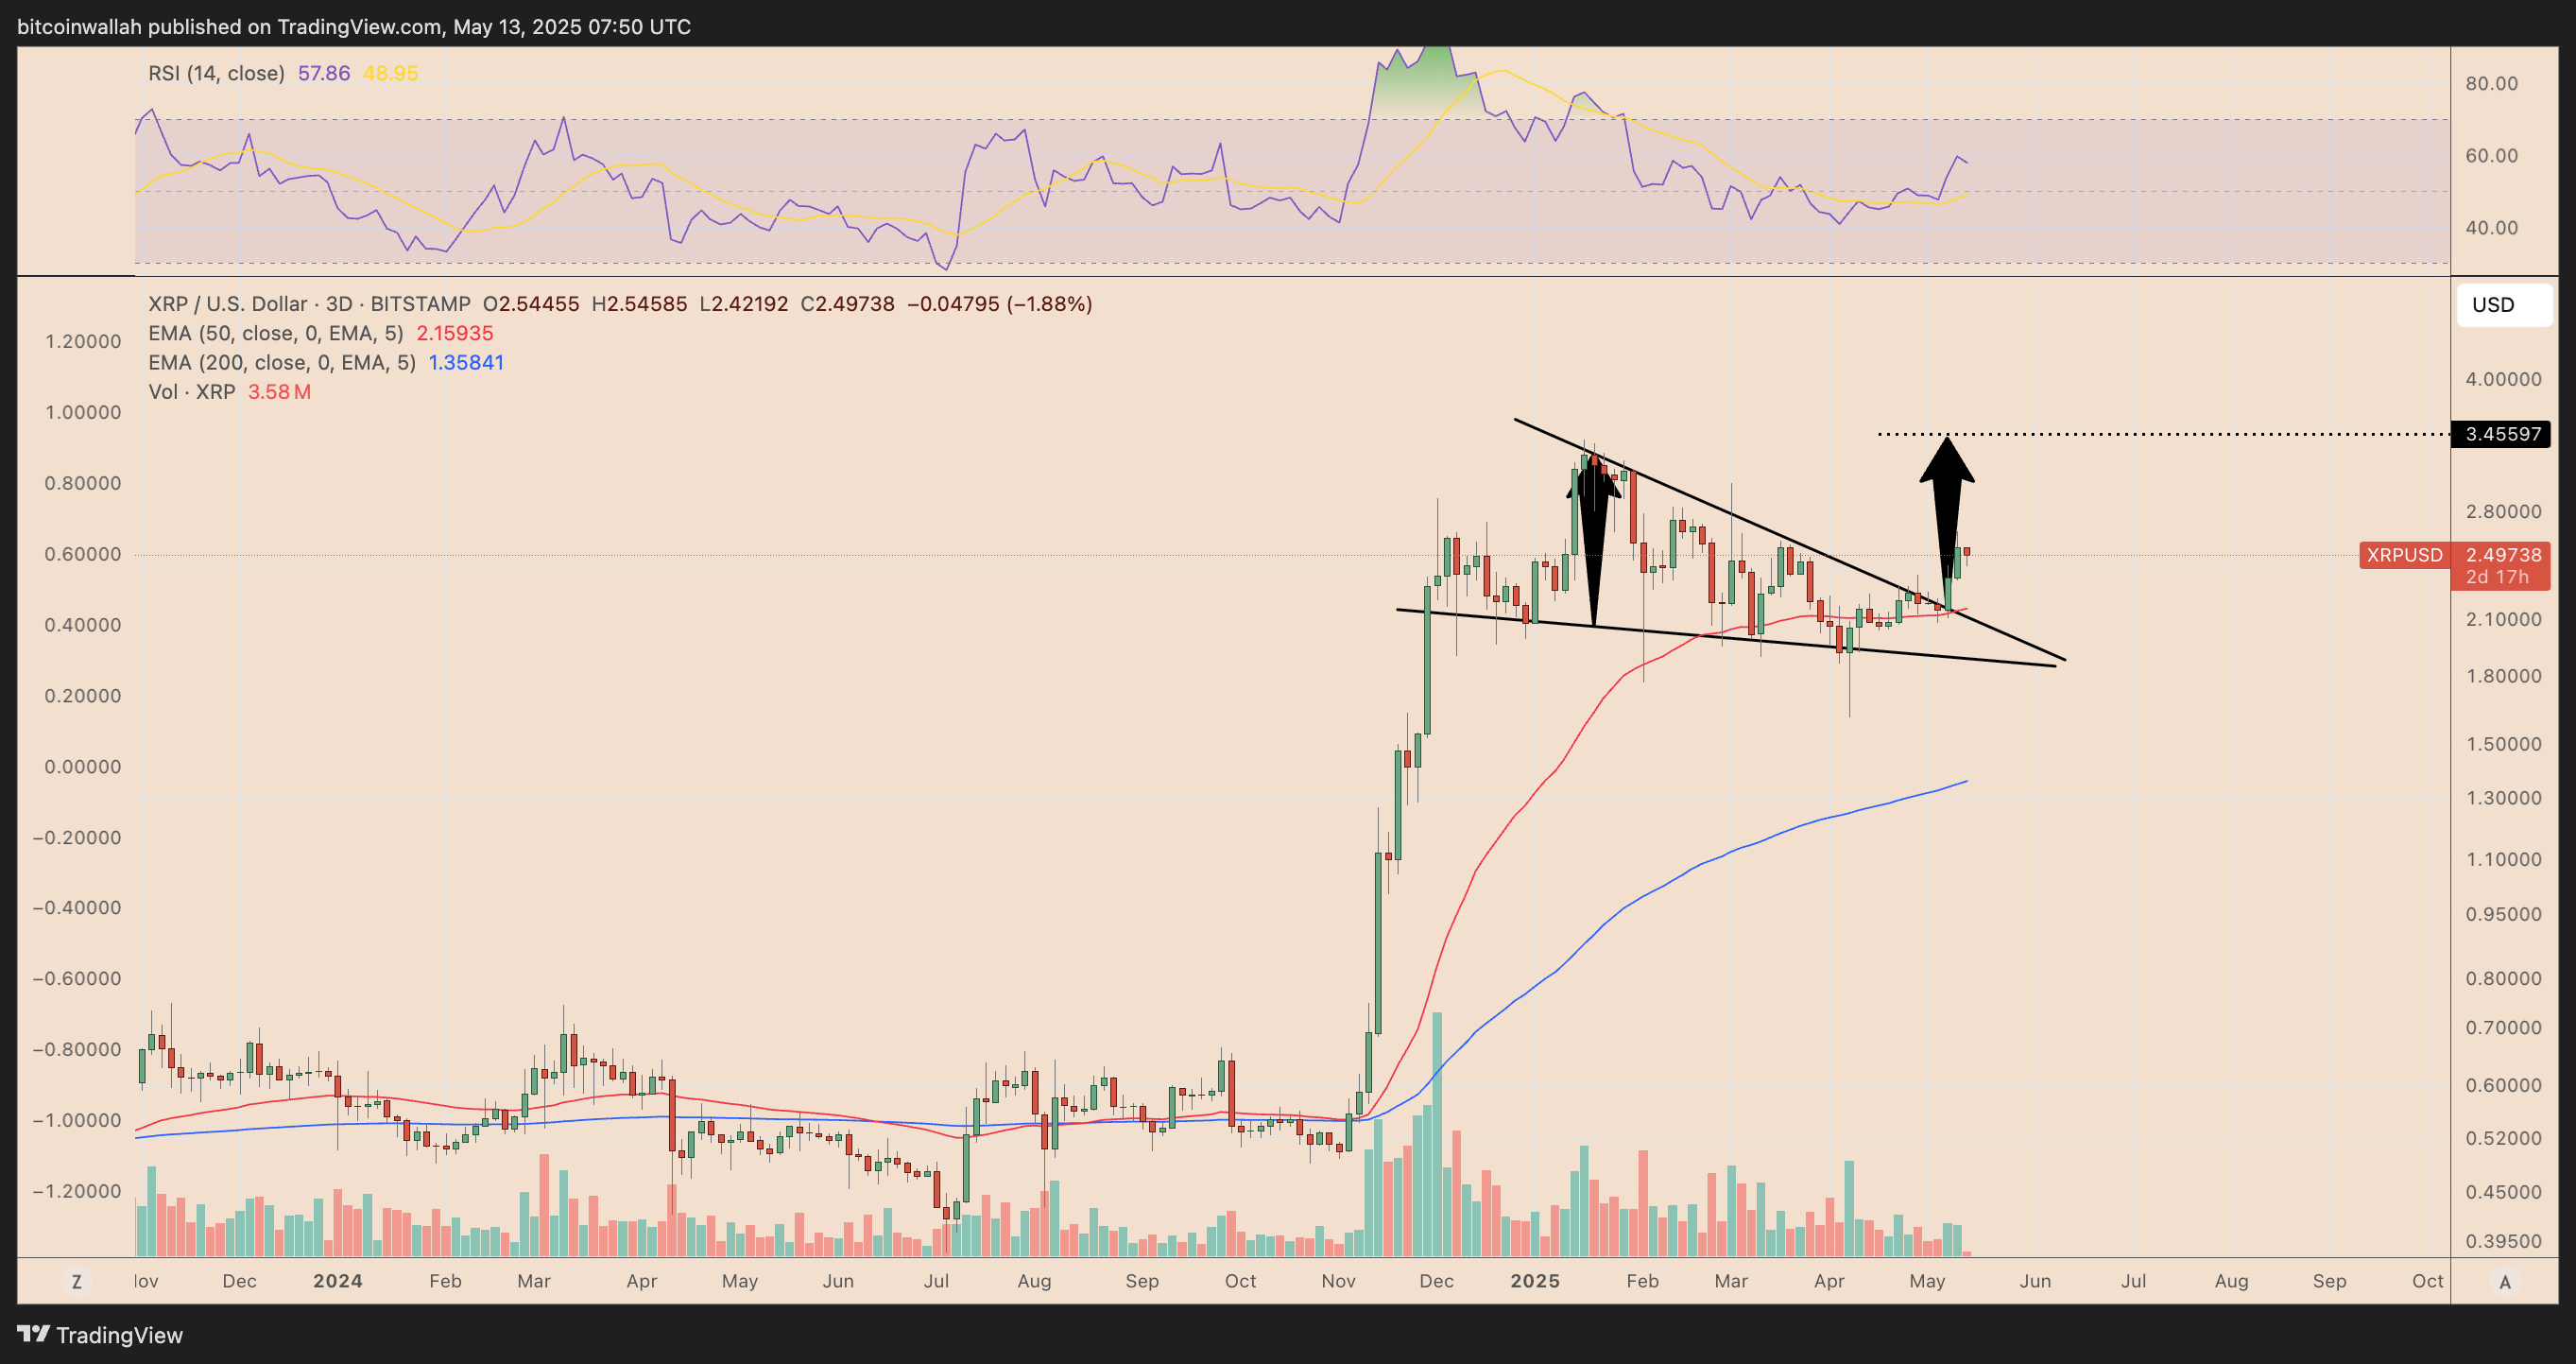
Adding to the bullish narrative, XRP is also breaking out of a multi-month falling wedge pattern on the 3-day chart, which is considered a classic bullish reversal setup. The wedge, formed between December 2024 and early May 2025, saw price action compress while volume declined, suggesting accumulation.
The breakout in early May near the $2.25 level, above the 50-period Exponential Moving Average (EMA), reinforces the bullish case. The wedge breakout projects a target price near $3.45, representing a 40% jump from current levels.
Obstacles and Potential Consolidation
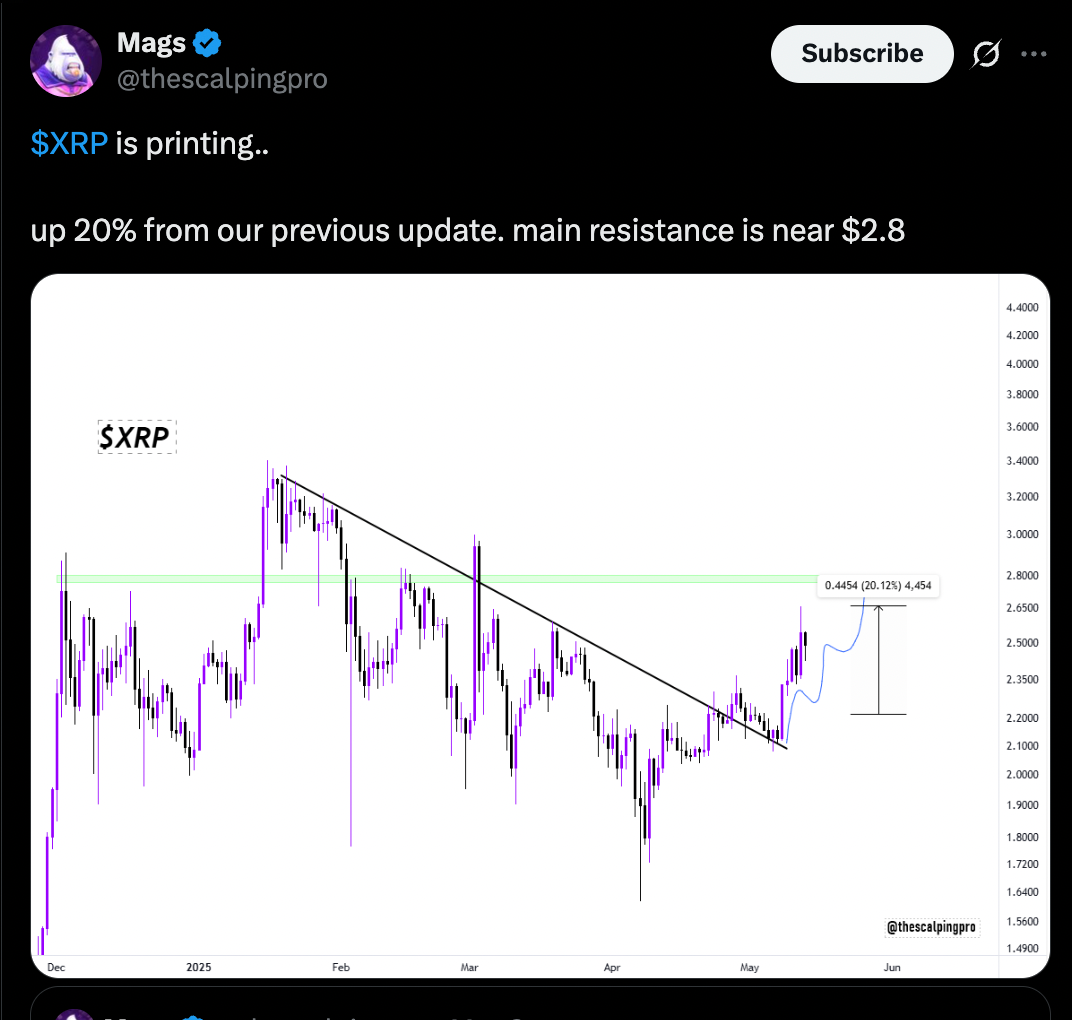
While the technical outlook and historical precedents point to a potential upside, analysts are cautious about a smooth ascent. XRP‘s Relative Strength Index (RSI) is showing renewed buying momentum, but analyst Mags highlights a key resistance level near $2.80 that could act as a temporary ceiling.
In the near term, XRP might consolidate above its 50-day EMA, which is a normal behavior during accumulation phases. This consolidation period, if consistent with past whale-driven rallies, could lay the foundation for a more robust price breakout in the future.
It’s crucial to remember that investing in cryptocurrencies involves inherent risks. This article does not provide financial advice, and readers should conduct their own research before making any investment decisions.